Pentacam® AXL Wave
The Next Generation
Pentacam® AXL Wave Basic Software
General Overview

Uses
- Comprehensive overview
- Customer consultation
Details
The General Overview provides important information on the keratometry and pachymetry of the cornea in concise numerical form. The Scheimpflug image provides opticians/optometrists and their customers with intuitive representations of opacities of the cornea or lens (cataract) or of the position of existing IOLs. The anterior chamber is described in terms of anterior chamber depth, volume and angle. When combined with IOP tonometry readings corrected for corneal thickness the General Overview permits an assessment of glaucoma risk. It also allows the display of all colour maps.
Fast Screening Report
Uses
- Quick detection of irregularities
- Customer consultation
Details
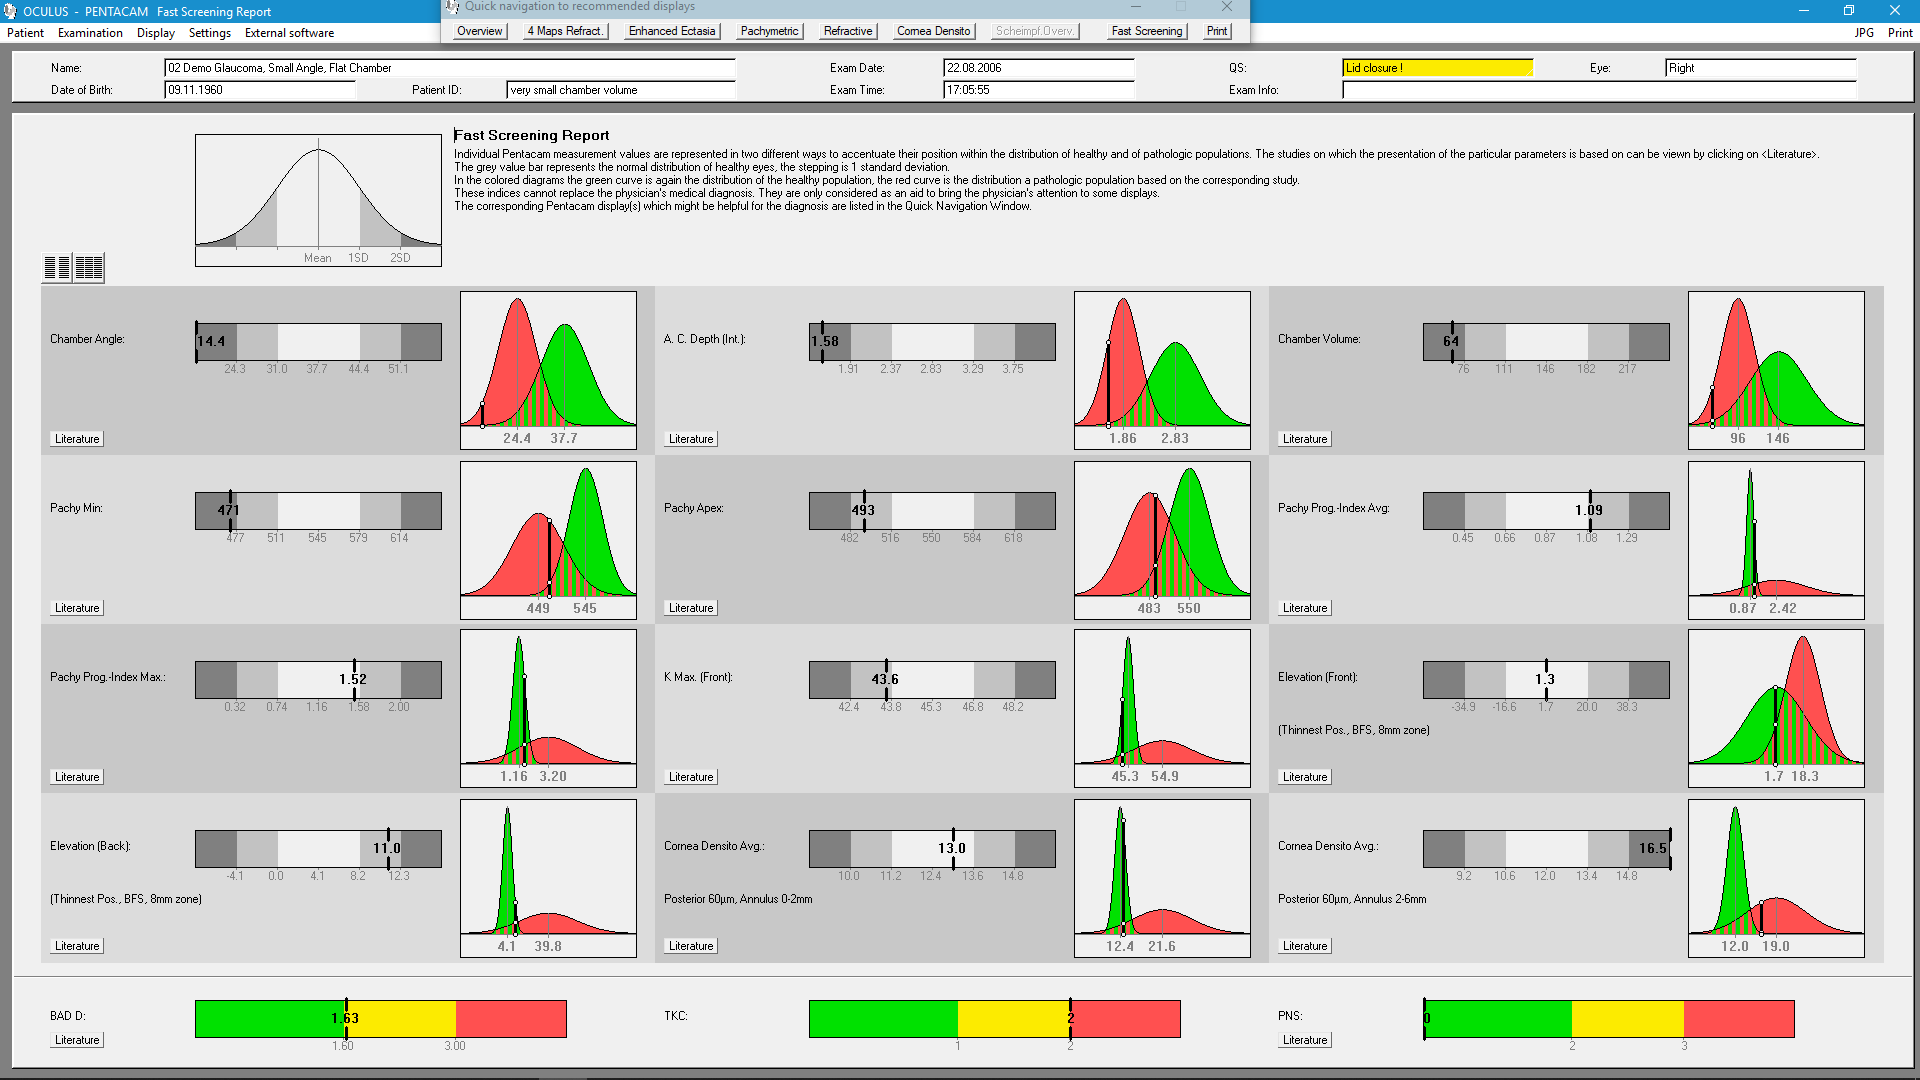
The Fast Screening Report provides a quick and simple overview that allows detection of irregularities in the anterior eye segment. Further displays for evaluating such irregularities in detail can be accessed via the navigation bar. Parameters are displayed against their normal distribution in healthy (green) as well as affected (red) populations as reported in published studies. The publication used in each case is identified under “Literature”. This display does not purport to give any kind of diagnosis. Diagnoses are the sole responsibility of the ophthalmologist and must be based on the entirety of information available.
Topography maps of the anterior and posterior corneal surface
Uses
- Ectasia detection
- Pre-surgical planning of refractive corneal surgery
- Follow-up after corneal surgery
- Calculation of IOL refractive power
- Planning of astigmatism reducing incisions (LRI)
- Follow-up after refractive surgery (pre-post LASIK)
Details
The rotating measurement principle guarantees high resolution of the data points in the central cornea. Topographic analysis of the anterior and posterior corneal surfaces is based on the measured elevation data.
- Sagittal, tangential-radial maps, refractive maps
- Various elevation maps in relation to freely selectable reference bodies
- True Net Power - calculation of total corneal power taking the posterior corneal surface into account
- Various four-colour maps, pre-set or individually configurable
- Differential and comparative representations of different examinations
Pachymetry maps, absolute and relative
Uses
- Pre-surgical planning of refractive corneal surgery
- Glaucoma screening
- Ectasia detection and quantification
- IOP evaluation taking into account measured corneal thickness based on various formulas (for ex. the Dresden correction table)
Details
An overview display in colour shows the corneal thickness from limbus to limbus. The measured values can be displayed in a pre-determined grid or represented manually at any point at a mouse click.
Automatic representation of:
- corneal thickness in the centre of the pupil
- corneal thickness in the apex
- the thinnest point of the cornea
- corneal volume
Scheimpflug Image Overview
Uses
- Check after scan abortion due to blinking
- All Scheimpflug images at a glance
Details
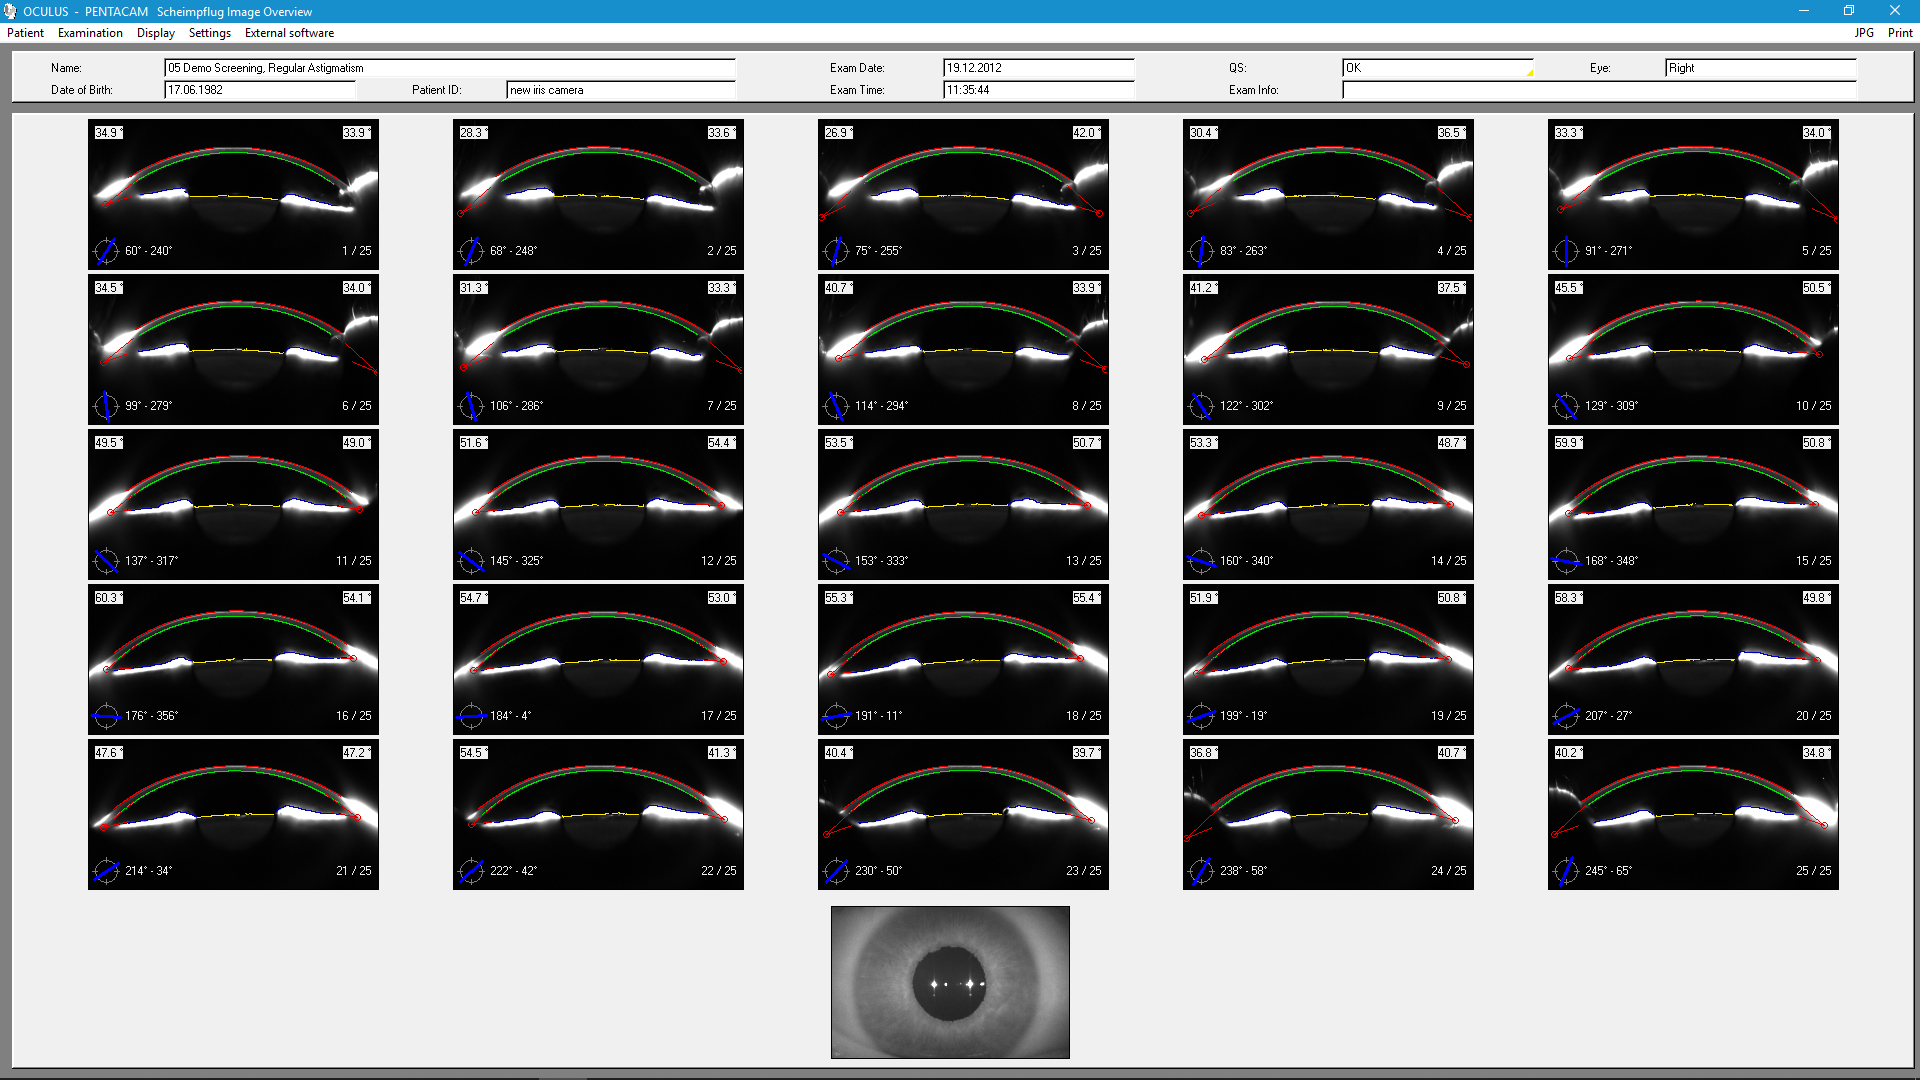
All Scheimpflug images are shown. This makes it possible, for example, to spot interferences with the measurement process (light, blinking etc.) at a glance. This display appears directly after completion of the measurement, providing the option of stopping further calculations and repeating the measurement. However, this is not intended as an alternative to the automatic assessment of image quality, displayed as QS (quality specification). It can reveal first signs of opacification of the cornea or crystalline lens.
Tomography
Uses
- Changes which become visible in the Scheimpflug image are lucidly represented in a 3D model.
- Anterior segment tomography
Details
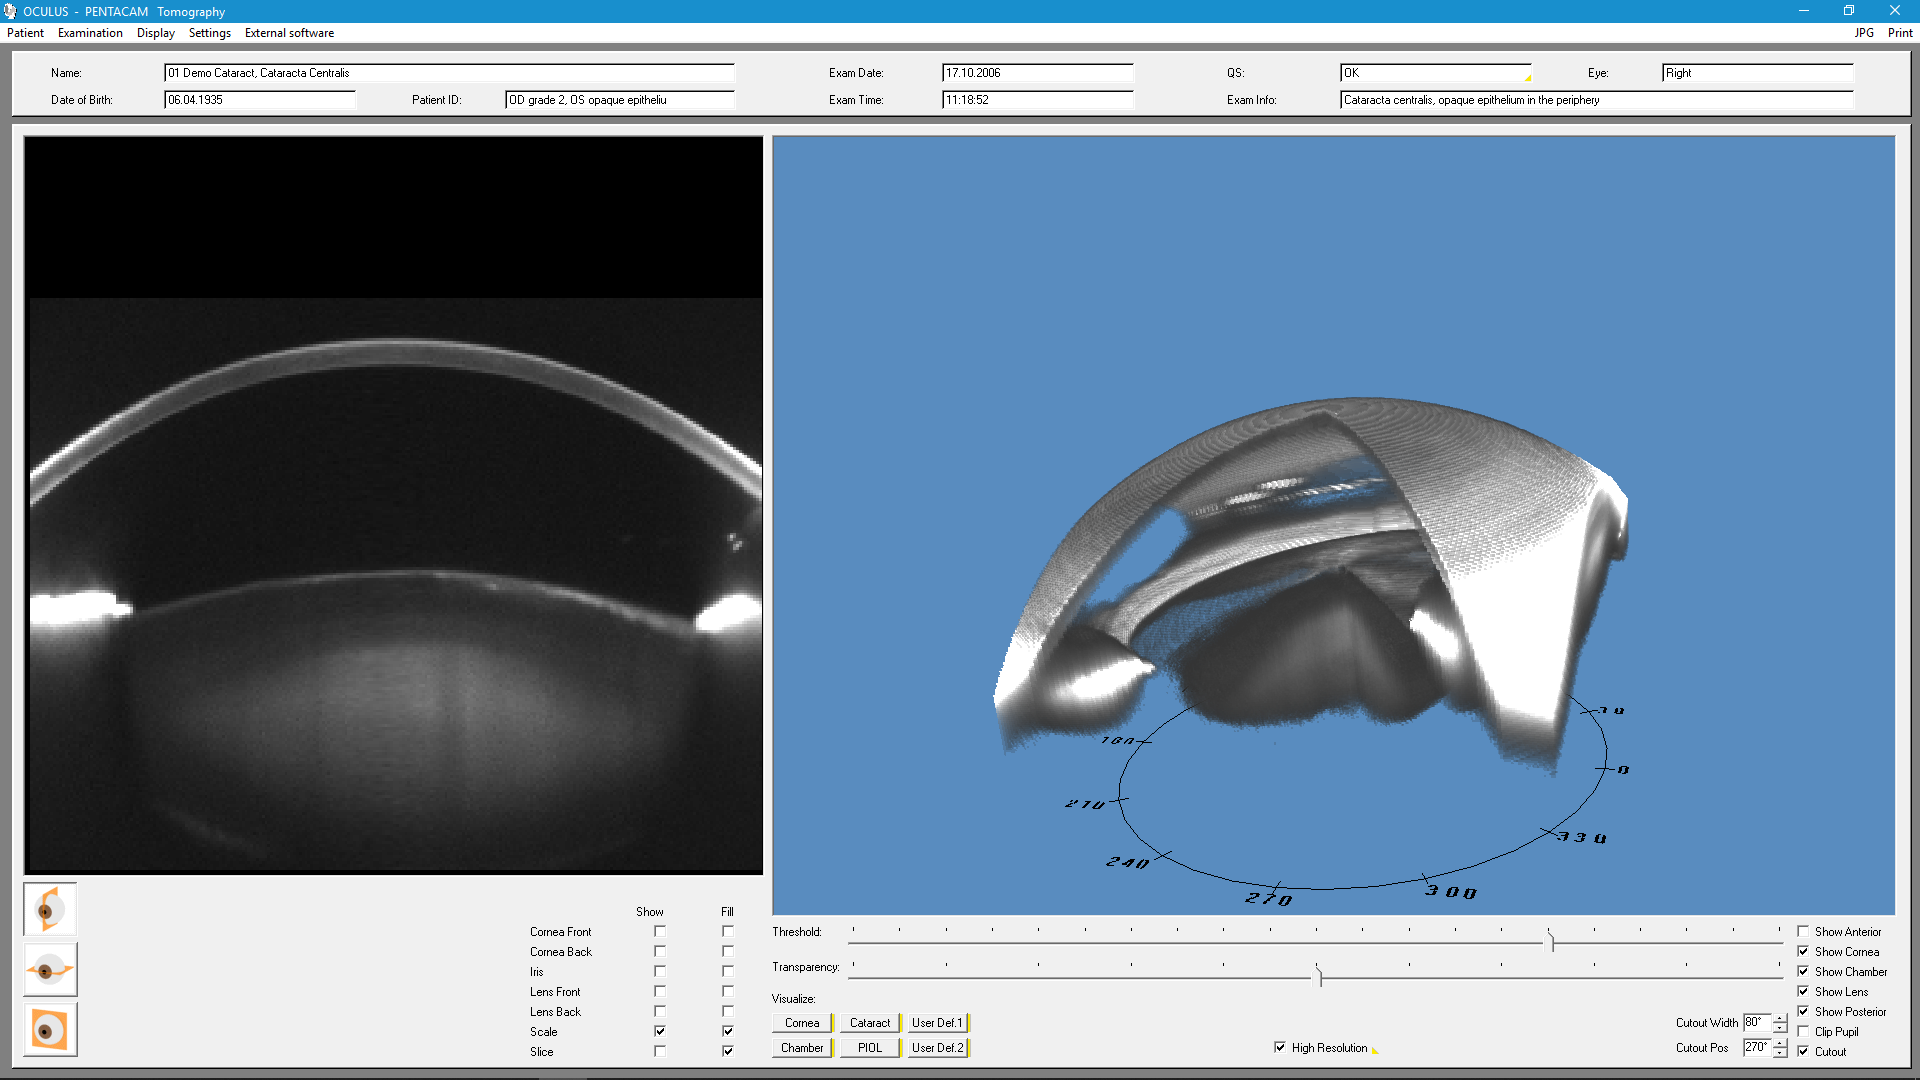
The rotatable, pivotable 3D model of the eye proves to be an enormous help when consulting with customers, as it permits the customer to see his or her eye from all sides so that irregularities can easily be explained. It provides a view of the anterior segment as a whole as well as separate views of the cornea and crystalline lens.
Topometric/KC-Staging
Uses
- Display of eccentricity results by zone
- Topography of the anterior and posterior corneal surface
Details
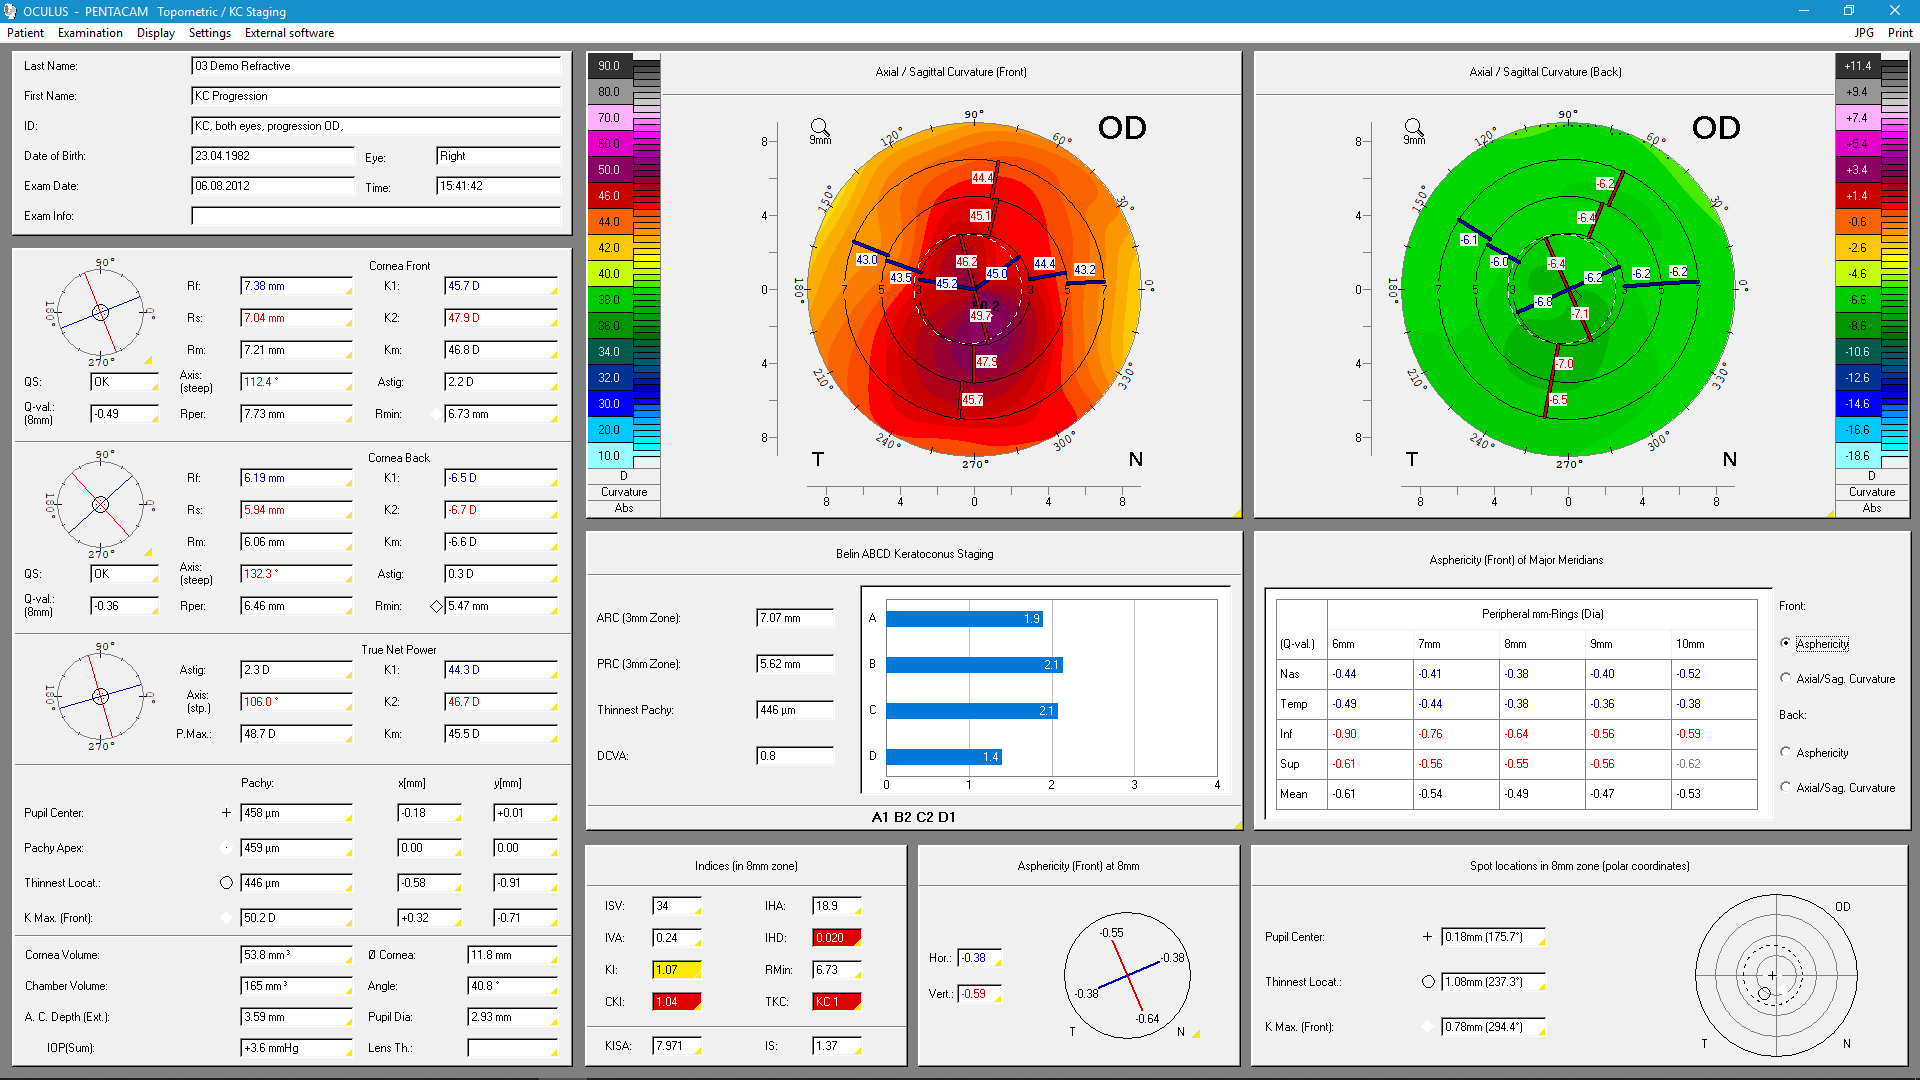
The rotating measurement principle guarantees high resolution output for the central cornea. The topographic analysis of the anterior and posterior corneal surfaces is based on the measured elevation data.
- Display of sagittal and tangential curvature of radius and refractive power
- Various elevation maps based on freely selectable reference surfaces
- Determination of true net corneal power with due consideration also to the posterior corneal surface
- Various four-map displays with default or freely configurable settings
- Subtractive and comparative representations of various examinations
Belin ABCD Keratoconus Staging
The new Belin ABCD Keratoconus Staging Display shows, at a glance, all parameters relevant to keratoconus classification, including the posterior corneal surface. The display can also be put to retrospective use, i.e., for classification of a patient’s earlier examination data.
Belin ABCD Progression Display

Uses
- NEW: Objective progression analysis after CXL treatment
- Keratoconus progression for up to eight exams per eye
- Direct comparison of right and left eye
- Retrospective application
Details
The Belin ABCD Progression Display allows direct comparison of up to eight exams per eye. The four parameters A (= anterior radius of curvature in 3 mm zone), B (= back/posterior radius of curvature in 3 mm zone), C (= corneal thickness at thinnest point) and D (= distance corrected visual acuity - DCVA) are displayed one above the other for easy detection of any trend of progression, both before and after CXL (corneal crosslinking).
The red and green lines indicate the relevant confidence intervals (CI) prior to treatment. The red lines stand for the keratoconus group and the green lines for the normal/healthy group. The solid lines indicate the 95 % CI and the dashed lines the 80 % CI.
The dashed horizontal black line represents the CXL treatment. The change in corneal behaviour after CXL treatment can be objectively analyzed based on the blue 80 % and 95 % confidence intervals. The blue lines only appear if exams are available from 12 months after treatment.
For details, watch video: Prof Belin, MD “Belin ABCD Progression Display – History & Utilization”
The Belin ABCD Keratoconus Staging (Topometric/KC-Staging) display and the Belin ABCD Progression Display can both be used retrospectively.
Iris Image
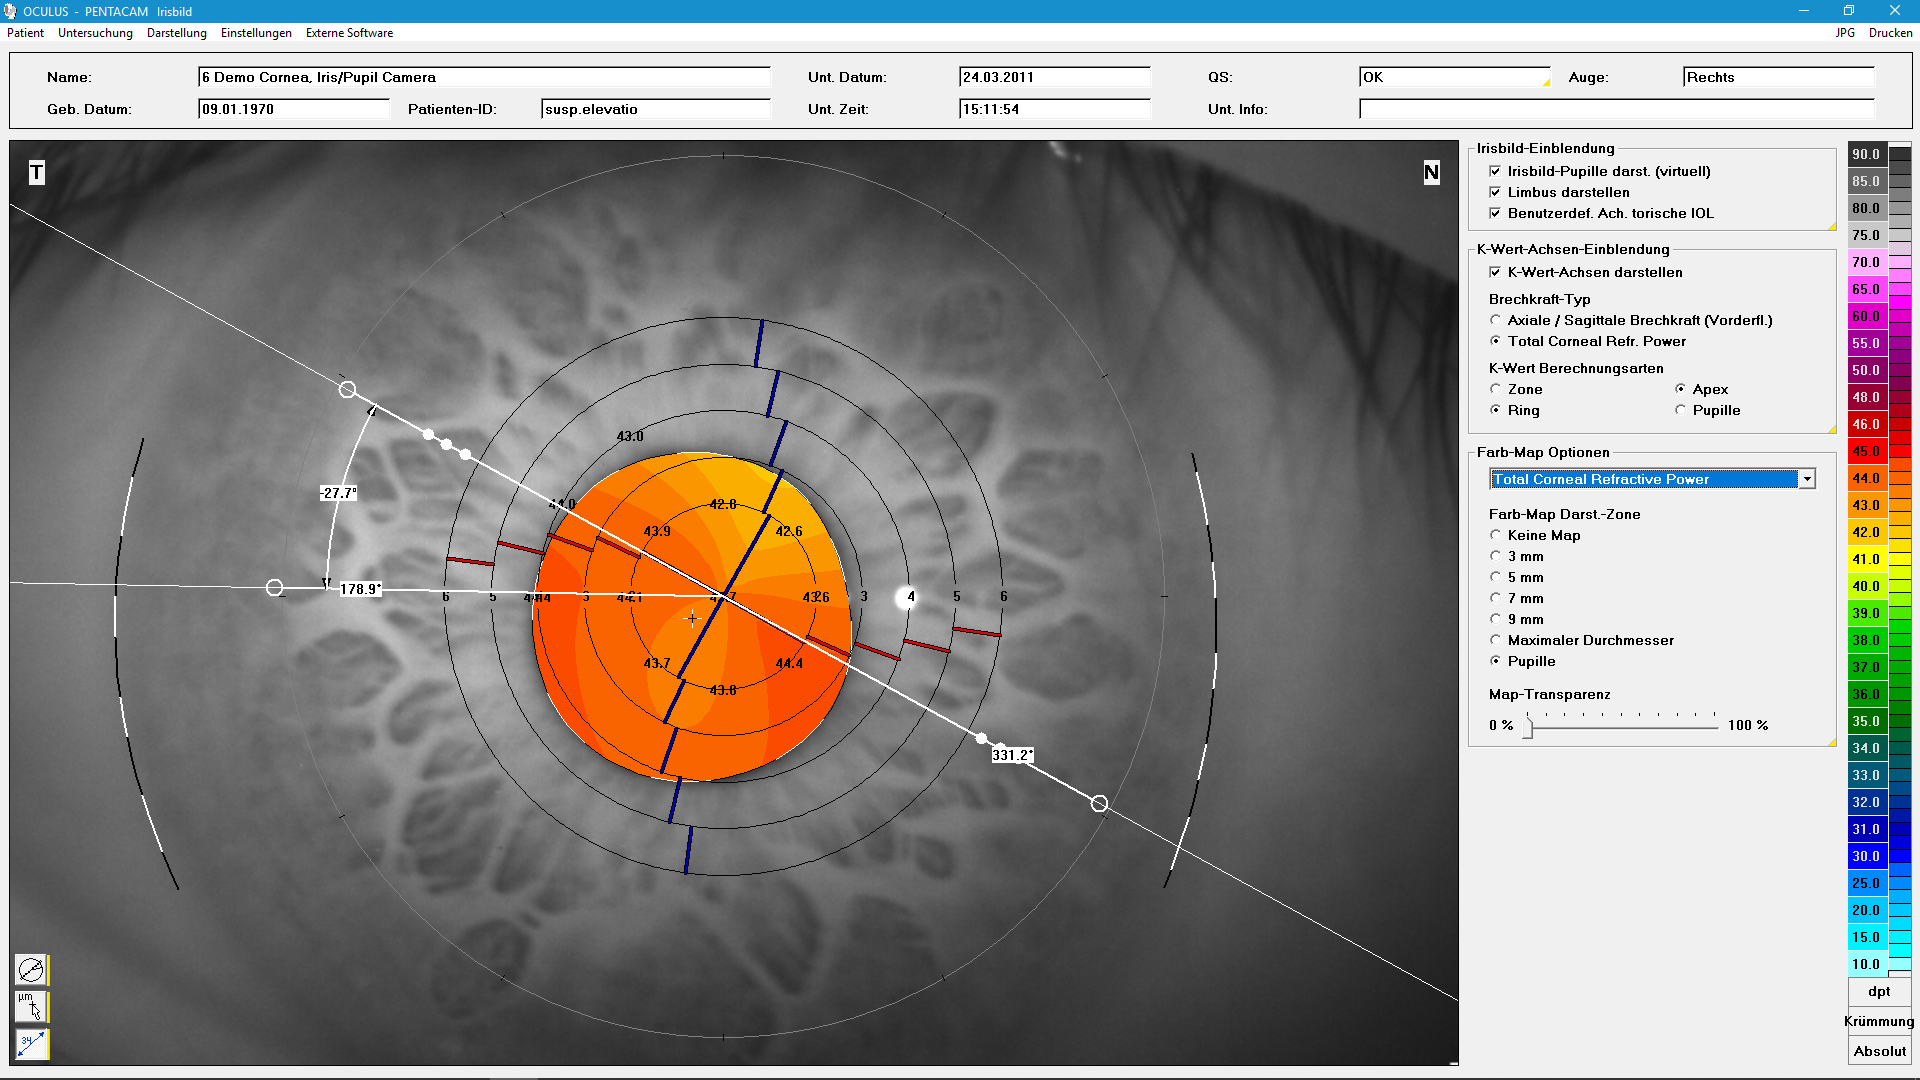
Details
Keratometry and Topography overlay for assessment of curvature, corneal power, pupil size and shape.
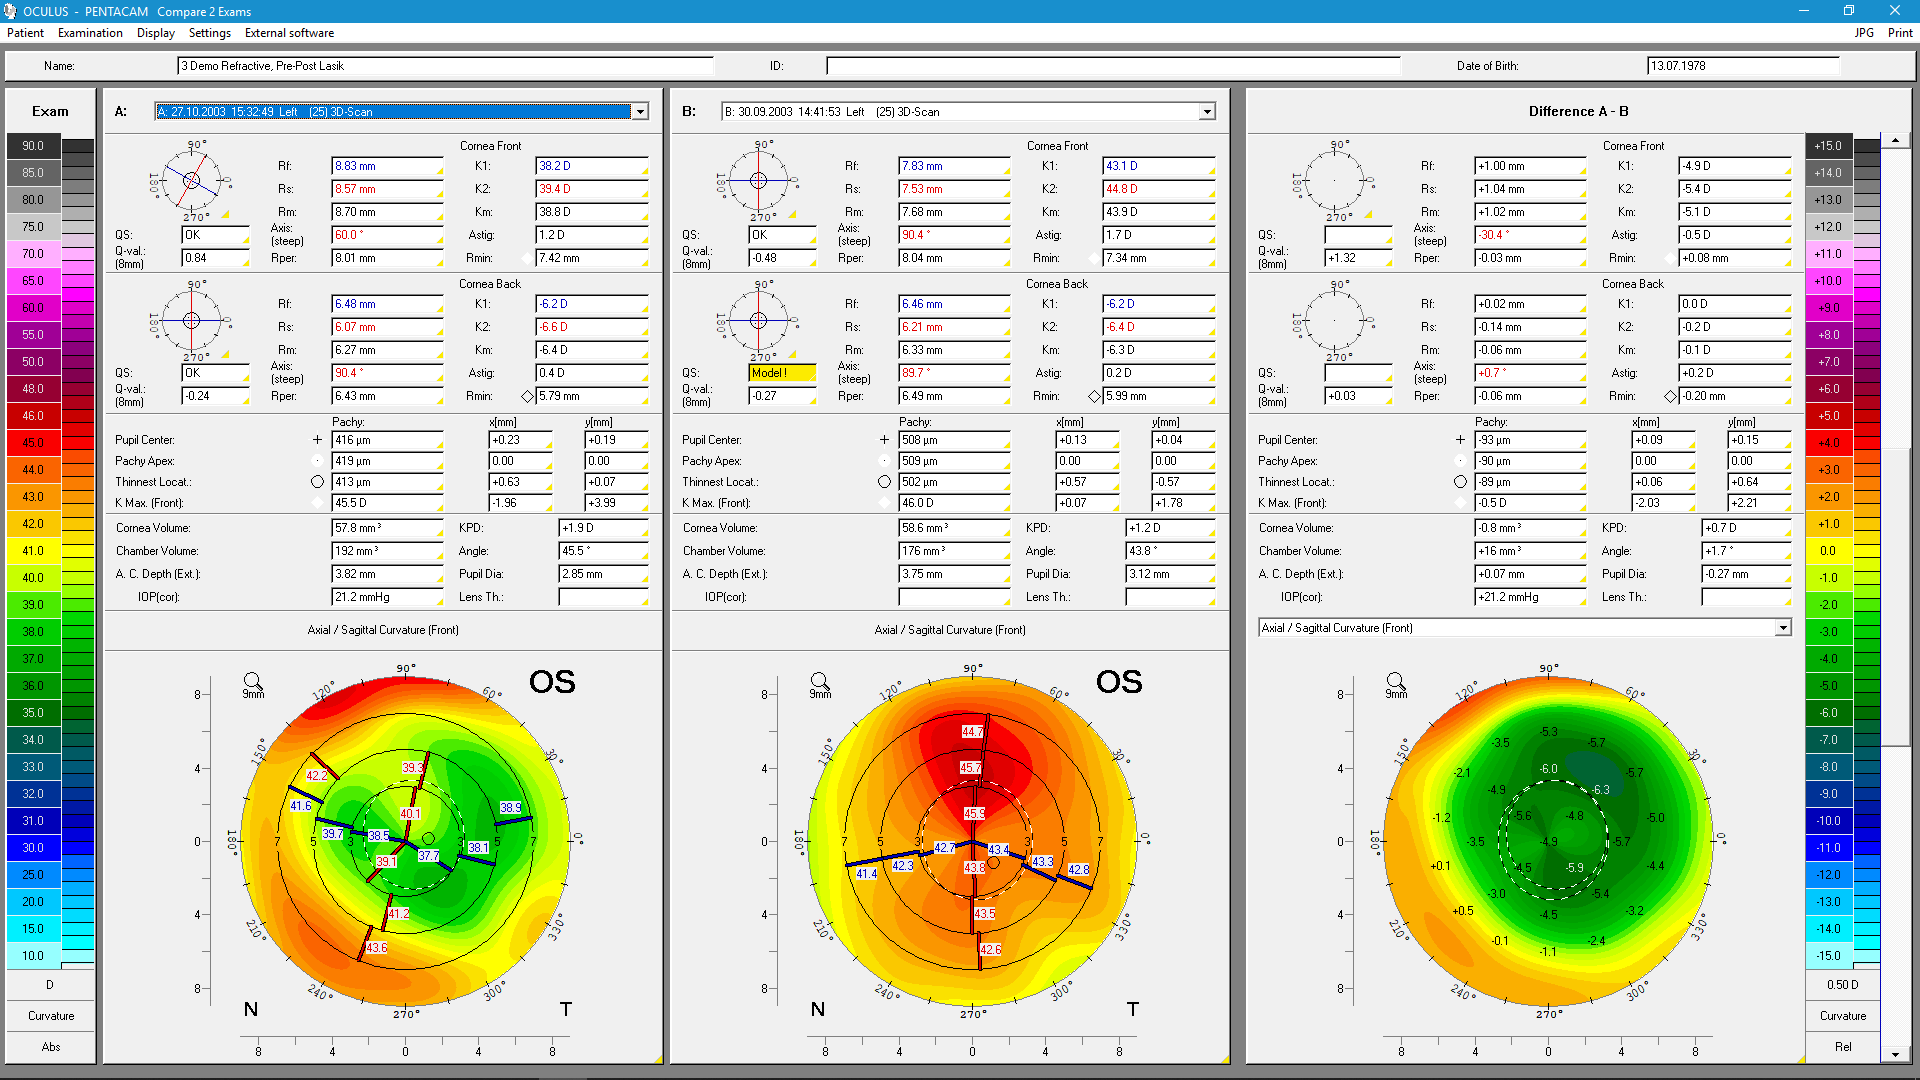
Compare 2 Exams
Show/Compare 2 Scheimpflug Images

Uses
- Follow-up
- Comparison of the preoperative and postoperative condition
Detail
All available colour maps from two different examinations can be compared. The course or change over time is displayed in colour maps or numerically in Scheimpflug images.
Cataract Package
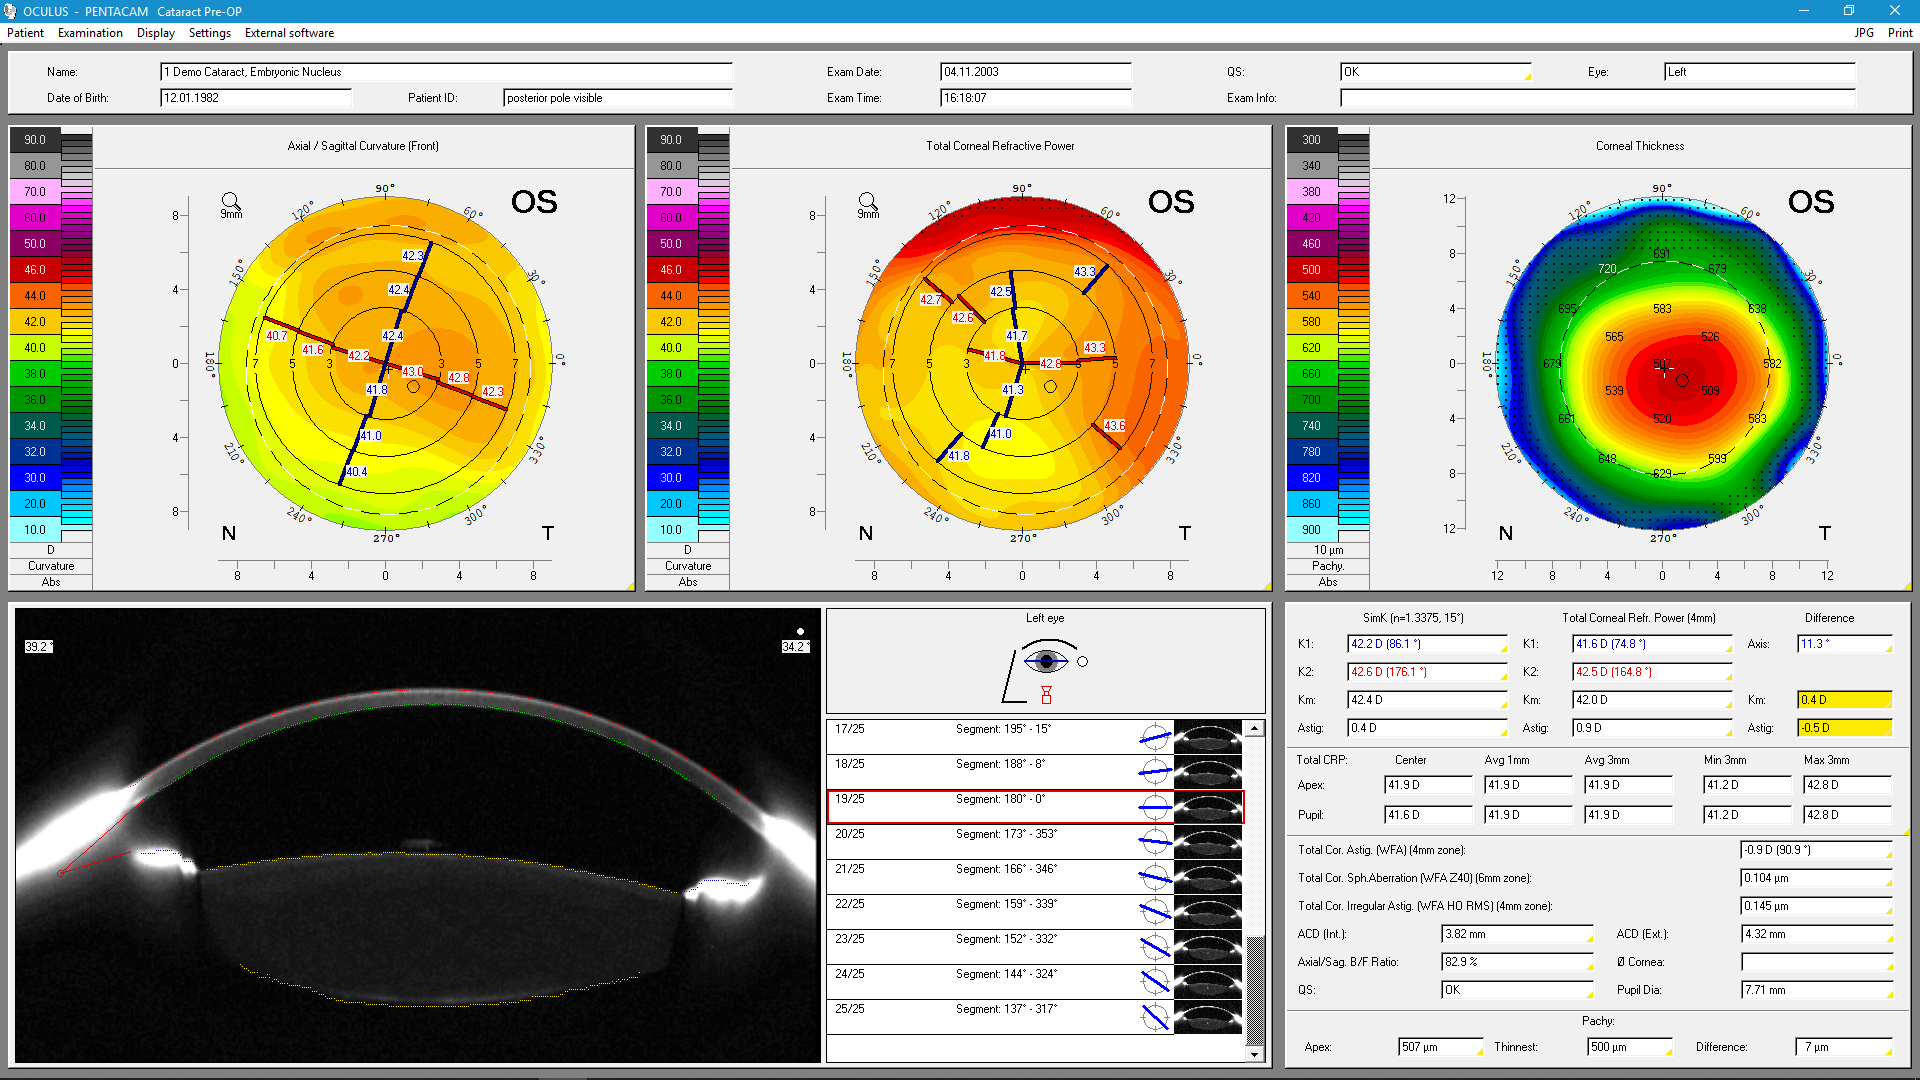

- Cataract Pre-Op Display for premium IOL selection and assessment of the optical properties of the entire cornea
- True Net Power map (TNP)
- Total Corneal Refractive Power map (TCRP)
- Power Distribution Display
- Zernike Analysis including normative corneal wavefront data
- PNS and 3D Cataract Analysis
- Show 2 Exams
- Compare 4 Exams
- Comparative analysis of topometric and pachymetric data
- Automatic anterior chamber angle analysis
- 4 Maps Chamber
- 4 Maps Topometric
- Anterior Chamber Depth Map
- Measurements in the Scheimpflug images
- 3D anterior chamber analysis
Refractive Package

- Free selection of reference surfaces for the colour representation of elevation data
- Corneal Optical Densitometry
- Corneal Rings
- Display of corneal thickness progression for keratoconus detection
- 4 Maps Selectable
- Show 2 Exams
- Compare 4 Exams
- Side-by-side comparison of topometric and pachymetric data
- Fourier Analysis
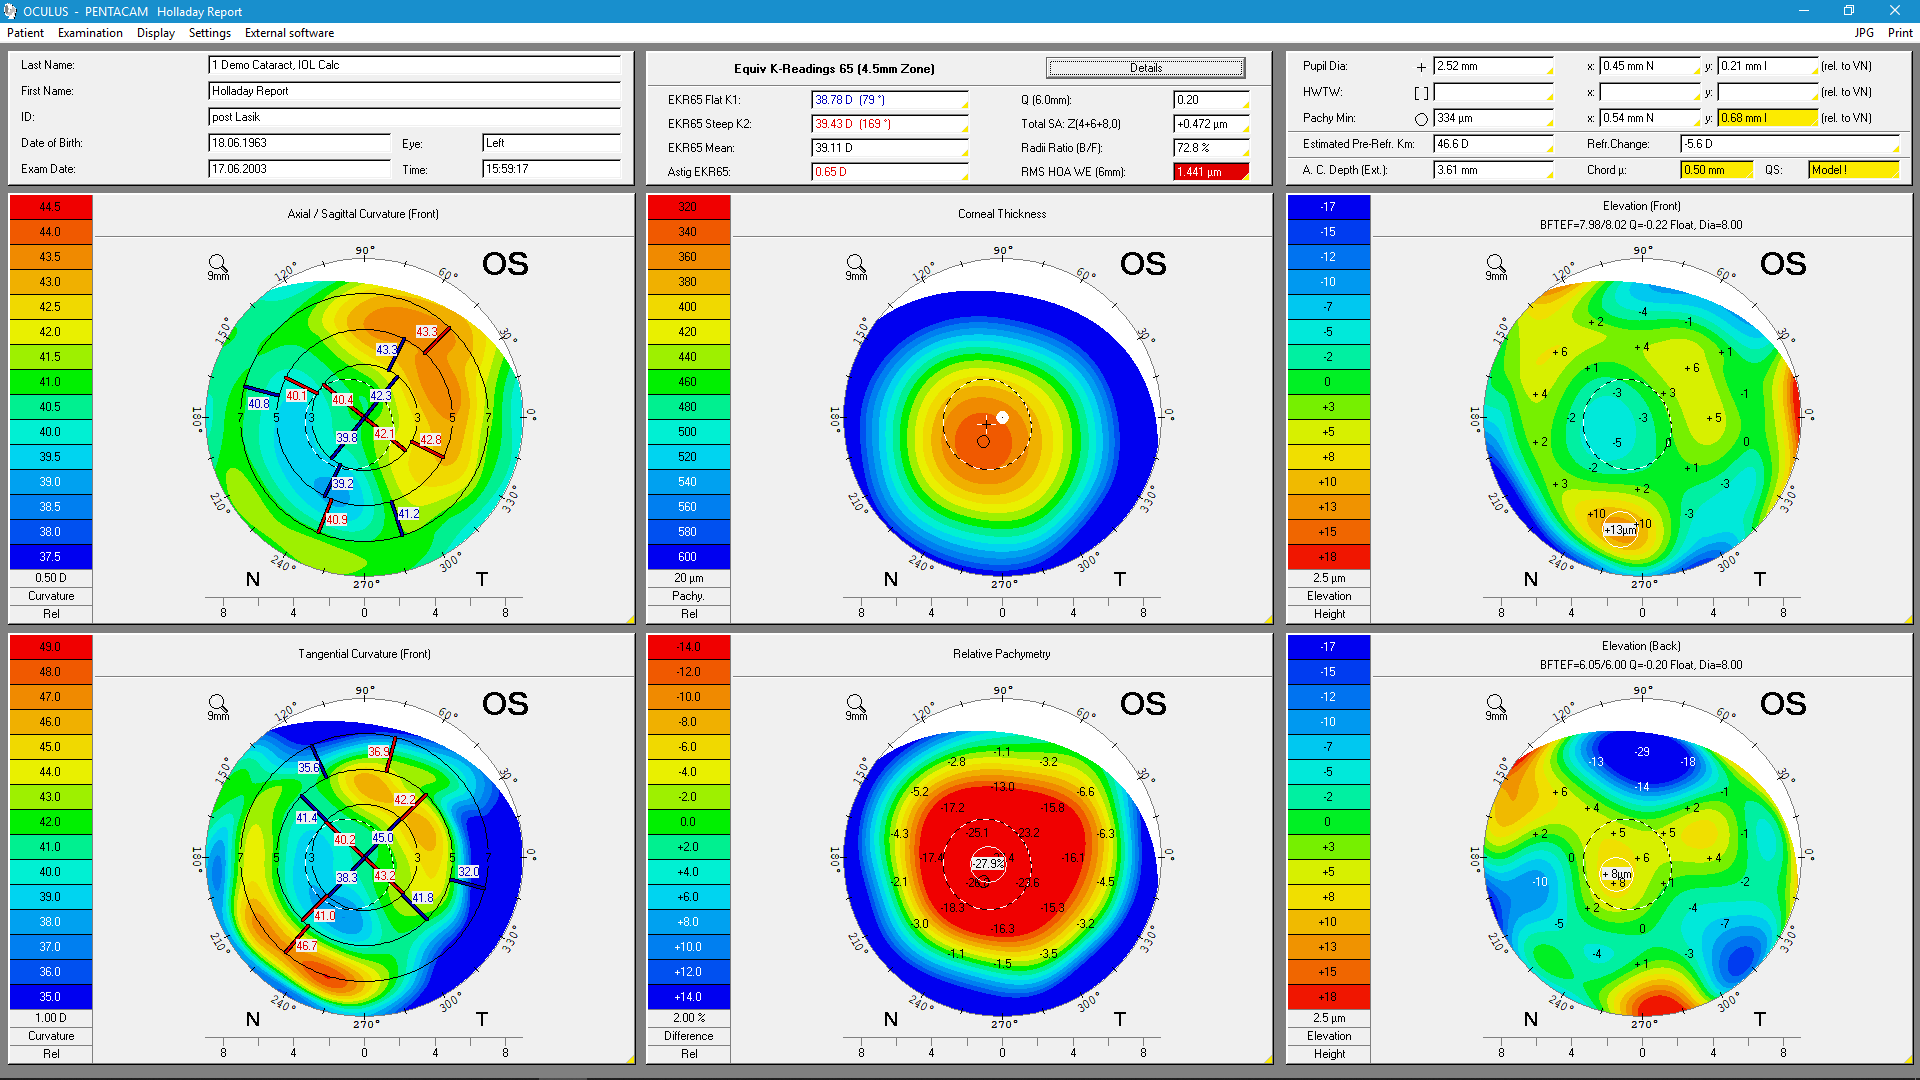
Holladay Report
Uses
- Comprehensive comparative display of clinical data
- EKRs (equivalent keratometer readings) for IOL calculations in post-refractive patients
Details
The Holladay Report was developed in collaboration with Jack T. Holladay, M.D. It supplies data for calculating the optimal IOL refractive power for patients who have undergone refractive corneal surgery such as LASIK, PRK and RK. It determines total corneal power, displaying it in terms of EKRs for different zones.
- Holladay et al; Corneal Power Measurements Using Scheimpflug Imaging in Eyes With Prior Corneal Refractive Surgery, J Refract Surg. 2009 Oct;25(10):862-8.
- Symes et al; Automated keratometry in routine cataract surgery: Comparison of Scheimpflug and conventional values, J Cataract Refract Surg. 2011 Feb;37(2):295-301
PNS and 3D Cataract Analysis
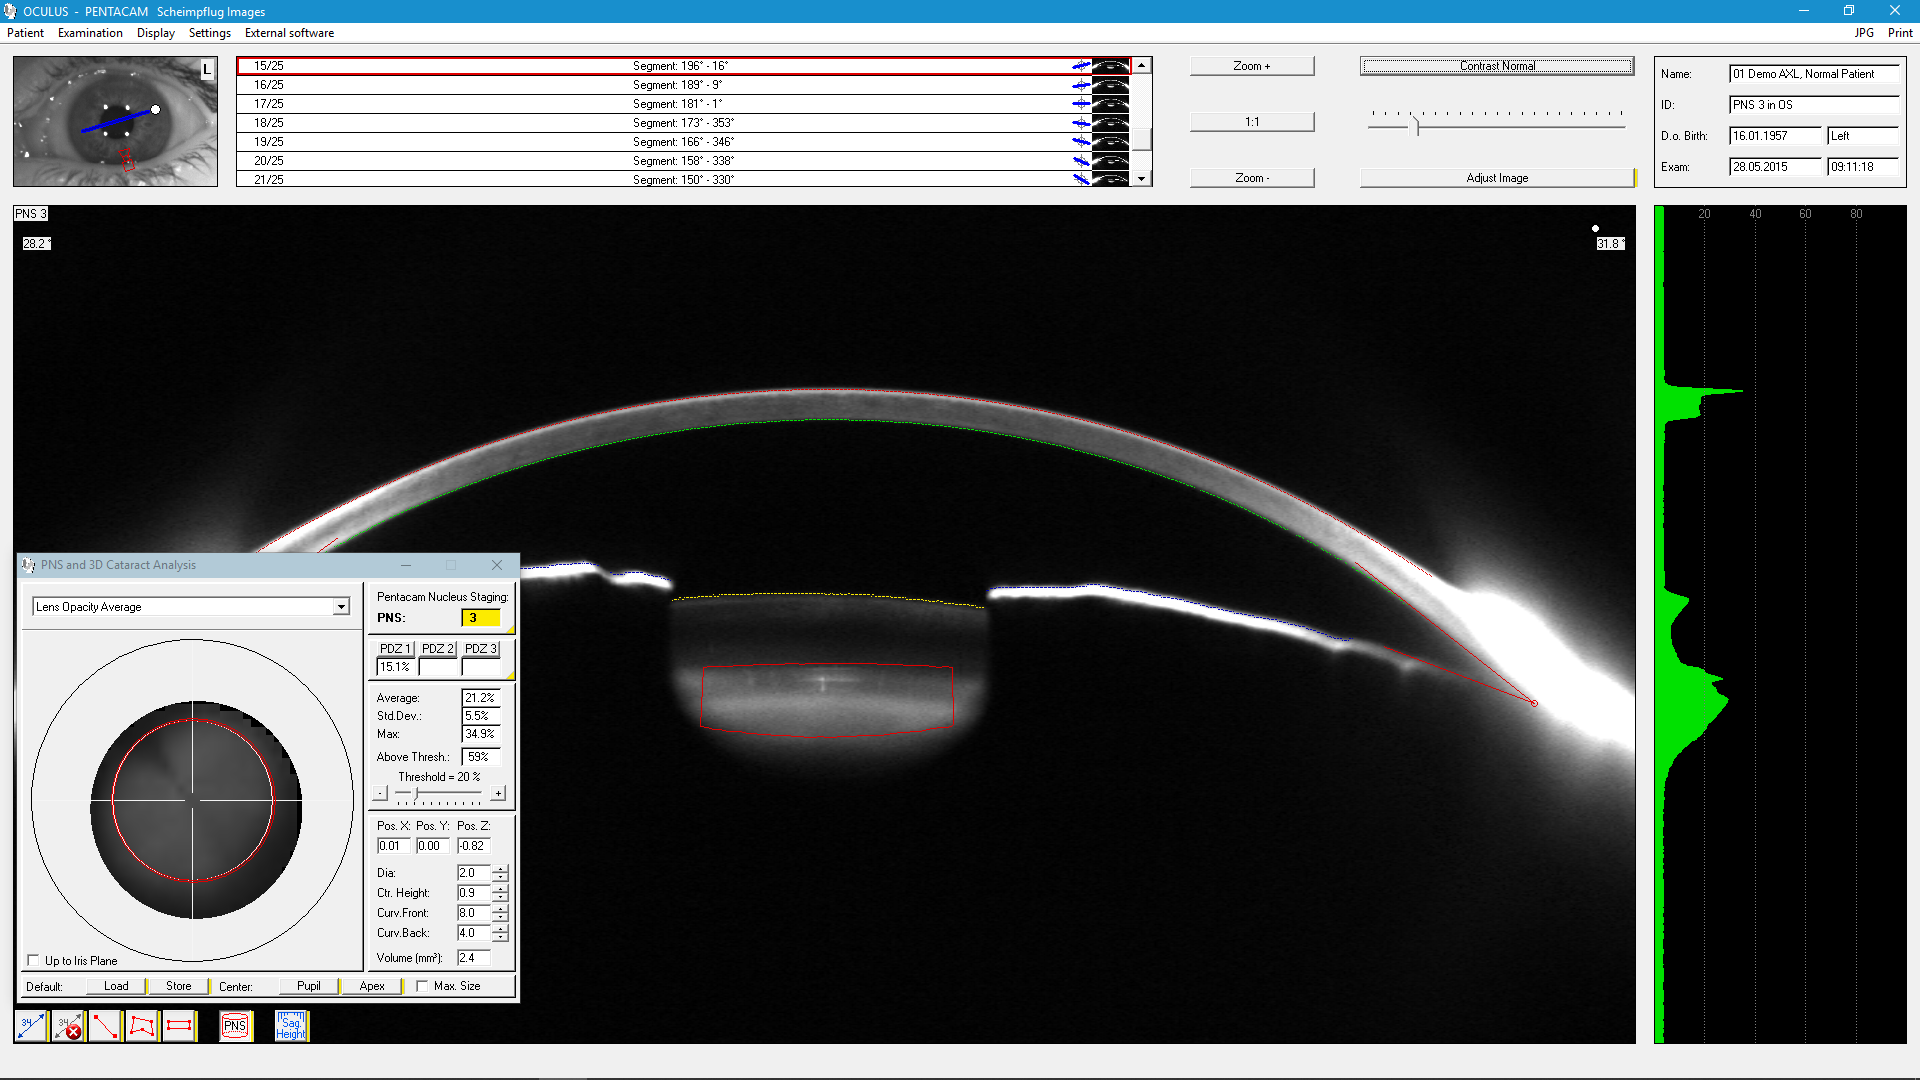
Uses
- Cataract classification
- Determination of lens opacities in 3D
Details
Opacities of the cornea, crystalline lens or of IOLs, e.g. PCO (posterior capsular opacification) are made visible by blue light illumination. The software allows automatic and objective three-dimensional quantification of lens opacity. This offers the advantage of an optimal follow-up of cataract patients. The Pentacam® Nucleus Staging Module, „PNS“ for short, was developed in collaboration with Dr. Donald Nixon. This parameter is helpful in optimizing the settings of phaco machines. It is also useful in femto laser assisted cataract surgery.
- Nixon et al; PREOPERATIVE CATARACT GRADING BY SCHEIMPFLUG IMAGING; doi:10.1016/j.jcrs.2009.08.032
- Meyer et al, Impact of Crystalline Lens Opacification on Effective Phacoemulsification Time in Femtosecond Laser-Assisted Cataract Surgery; AJO; doi.org/10.1016/j.ajo.2013.09.017
Corneal Optical Densitometry

Uses
- Location of corneal opacities
- Assessment of the depth and degree of opacification
Details
This software provides a standardized method of selective quantification of corneal opacities. The maximum and average corneal opacity is displayed in a colour map. Opacities can also be viewed in selected layers. Corneal opacities are shown for defined annuli and depths, facilitating uniform evaluation. This function served as a basis in the normative data studies listed below.
- Sorcha Ni Dhubhghaill, Jos J. Rozema, Sien Jongenelen, Irene Ruiz Hidalgo, Nadia Zakaria,Marie-Jose Tassignon; Normative Values for Corneal Densitometry Analysis by Scheimpflug Optical Assessment, IOVS, January 2014, Vol. 55, No. 1, 164.
- Sorcha Ni Dhubhghaill, Jos J. Rozema, Marie-Jose Tassignon; Corneal Scheimpflug Densitometry Values measured by Pentacam in Fuchs Endothelial Dystrophy, ARVO 2014, Program Number: 2447 Poster Board Number: B0232
IOL Calculator
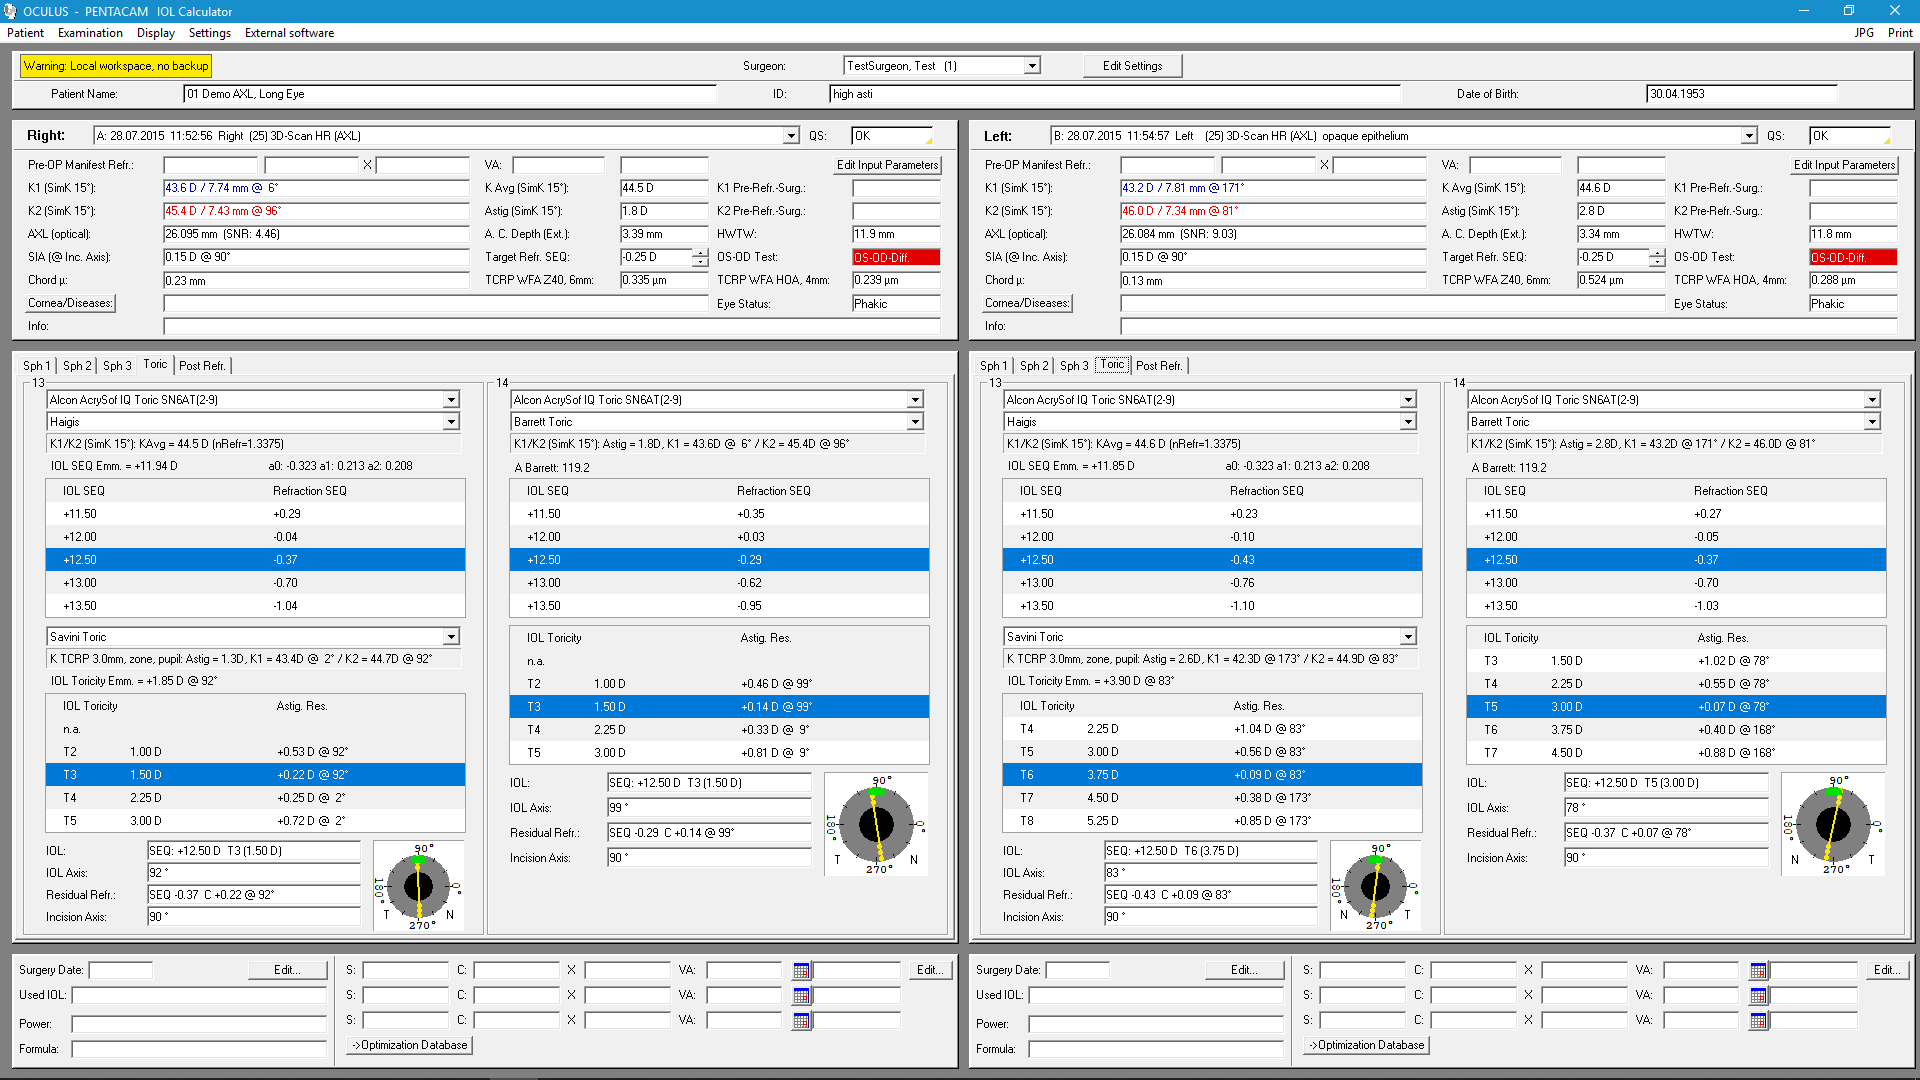
Uses
- comprehensive IOL planning
- IOL calculation
- documentation
- constant optimization
Details
Originally developed for the Pentacam® AXL, the IOL Calculator is now also available in the Pentacam® HR. It offers space for up to 25 ophthalmologists to maintain their own set of up to 50 favourite IOLs. A large IOL database has been incorporated into the software for this purpose. If an IOL should ever be found missing, it can be added manually. Each user initializes their personal IOL Calculator by picking IOLs from their favourites list. If no further changes are made and everything has been set up as desired, the user only needs to load an examination, and the software will automatically calculate IOLs suitable for that patient. In doing so it takes into account the keratometry data, the induced astigmatism and the target refraction. Templates for calculating spherical, aspherical, multifocal, toric and toric multifocal IOLs as well as post-refractive-surgery IOLS are included. In addition to the standard formulas of SRK/T, Haigis, HofferQ, Holladay and Barrett Universal II it also provides Pentacam®-specific post-refractive-surgery IOL formulas derived from dedicated studies. The well-known double K formulas and the three Barrett formulas have been incorporated here as well. But the real highlight in the IOL Calculator is its ability to calculate toric IOLs based on TCRP (total corneal refractive power) according to Dr. Savini. Toric IOL calculation according to Barrett is also in the repertoire. After surgery the implanted IOL can be loaded from the templates and saved along with the date of surgery. After successfully entering the post-refractive outcome (≥ 30 days) the examination can be earmarked for constant optimization.
The software also provides interfaces for calculating IOLs with the Okulix and Phaco Optics raytracing programs as well as for incorporating further calculators such as the Holladay Consultant.
Belin/Ambrósio Enhanced Ectasia Display
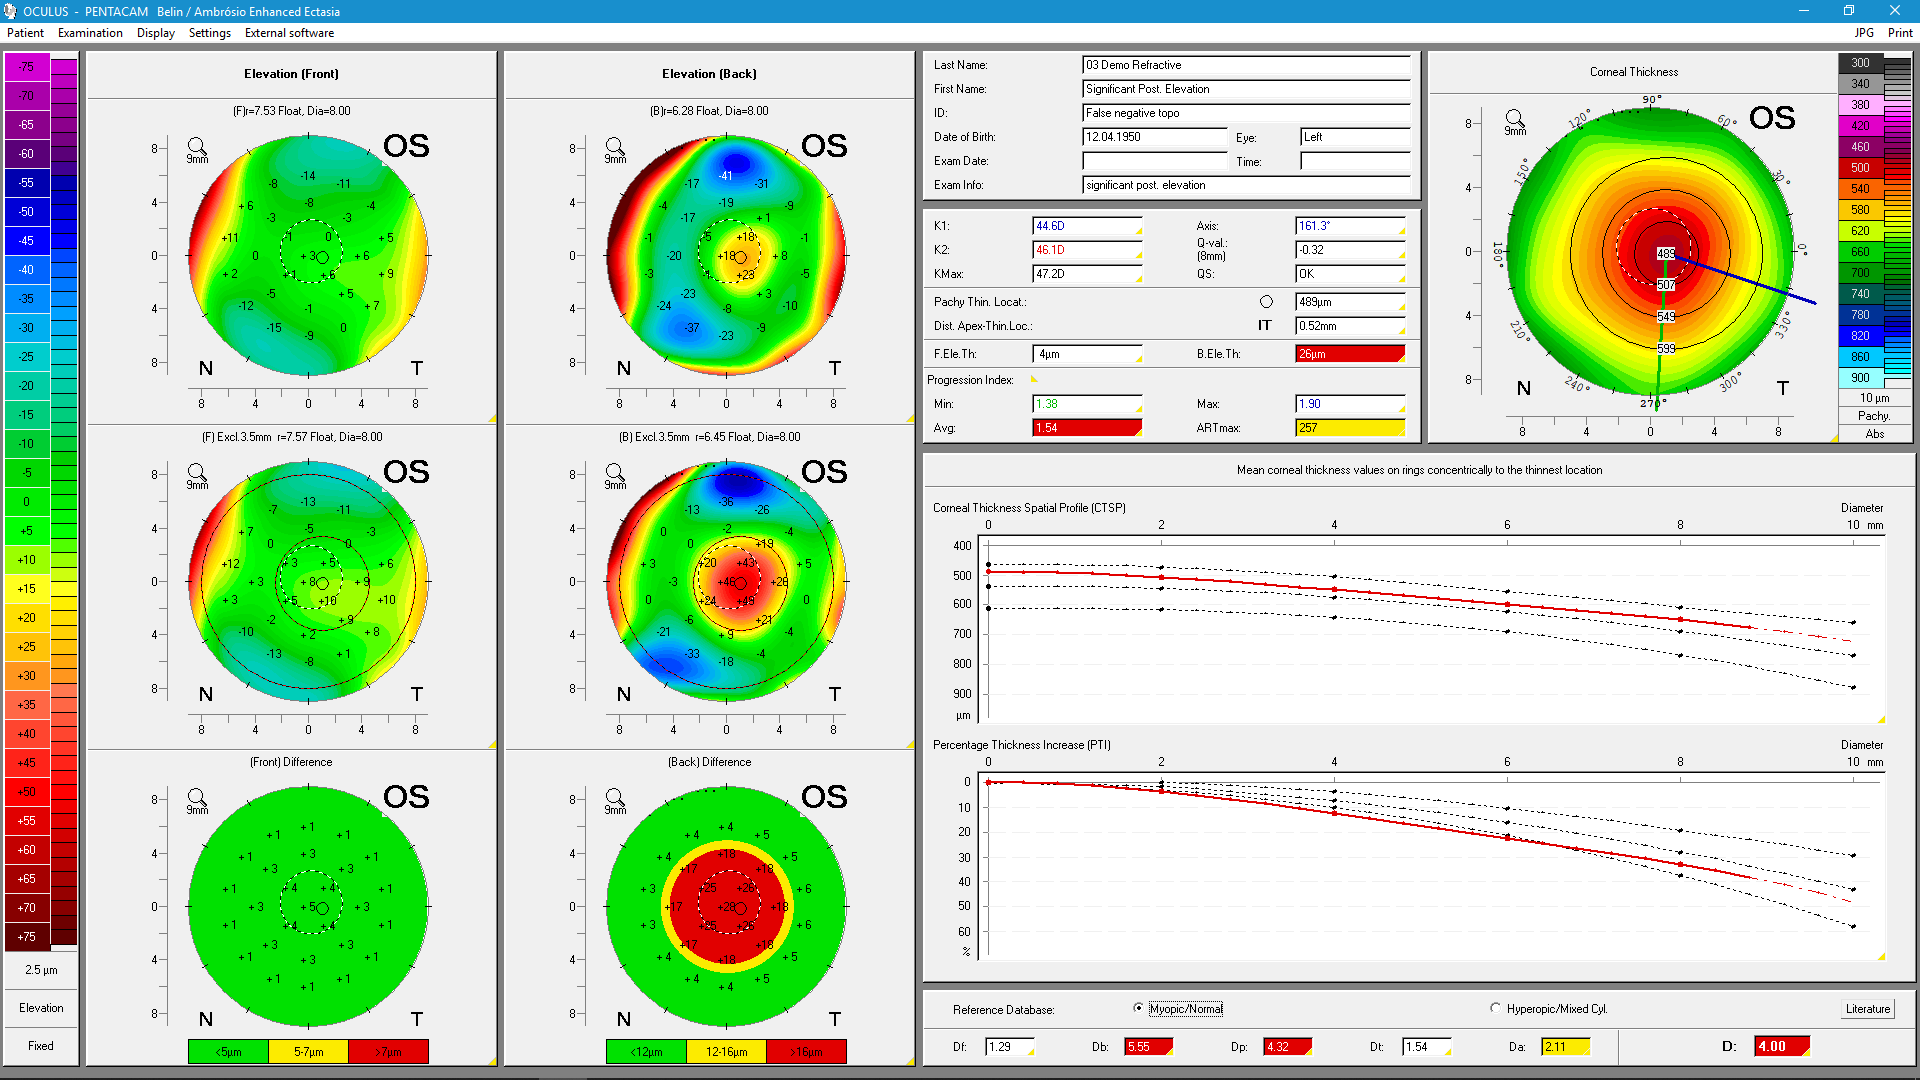
Uses
- Early ectasia detection
- Reliable detection of forme-fruste keratoconus
Details
The Belin/Ambrósio Enhanced Ectasia Display is the first screening tool to combine anterior and posterior corneal elevation data with an evaluation of corneal thickness progression in a final parameter, referred to as Index D. Besides allowing for greater overall accuracy in diagnosing ectasia it can in particular assist in the early detection of this disorder. It determines the progression of corneal thickness across an array of concentric rings centered on the thinnest point and reaching into the periphery. Two elevation maps are generated, one based on a standard reference surface and the other on an enhanced reference surface, and the differences found between them are shown in a colour code to facilitate evaluation: green for unremarkable, yellow for conspicuous, and red for potentially pathological.
- Villavicencio et al, Independent Population Validation of the Belin/Ambrosio Enhanced Ectasia Display: Implications for Keratoconus Studies and Screening, Int. Journal of Keratoconus and Ectatic Corneal Diseases, Jan-Apr 2014;3(1):1-8
- Ambrosio et al; Corneal-thickness spatial profile and corneal-volume distribution: Tomographic indices to detect keratoconus, J Cataract Refract Surg - VOL 32, NOVEMBER 2006
- Khachikian et al; Posterior Elevation in Keratoconus, Ophthalmology; Volume 116, Issue 4 , Pages 816-816.e1, April 2009
- Ambrosio et al; Corneal Ectasia After LASIK Despite Low Preoperative Risk: Tomographic and Biomechanical Findings in the Unoperated, Stable, Fellow Eye, J Refract Surg. 2010 Nov;26(11):906-11.
- Belin et al; Corneal Ectasia Risk Score: Statistical Validity and Clinical Relevance, Journal of Refractive Surgery Vol. 26, No. 4, 2010;
- Kim et al; Tomographic Normal Values for Corneal Elevation and Pachymetry in a Hyperopic Population, J Clinic Experiment Ophthalmol Volume 2, Issue 2, 1000130; ISSN:2155-9570;
- Feng et al; International values of corneal elevation in normal subjects by rotating Scheimpflug camera, J Cataract Refract Surg 2011; 37:1817-1821 Q 2011 ASCRS and ESCRS;
- Ambrosio et al; Novel Pachymetric Parameters Based on Corneal Tomography for Diagnosing Keratoconus, J Refract Surg. 2011 Oct;27(10):753-8;
- Correia et al; Topometric and Tomographic Indices for the Diagnosis of Keratoconus, International Journal of keratoconus and Eczatic Diseases, May-August 2012; 1 (2):92-99;
- Gilani et al; Comprehensive anterior segment normal values generated by rotating Scheimpflug tomography, J Cataract Refract Surg 2013; 39:1707-1712 Q 2013 ASCRS and ESCRS;
- Ambrosio et al; Corneal Ectasia After LASIK Despite Low Preoperative Risk: Tomographic and Biomechanical Findings in the Unoperated, Stable, Fellow Eye, Journal of Refractive Surgery Vol. 26, No. 11, 2010
Contact Lens Fitting incl. fourier analysis
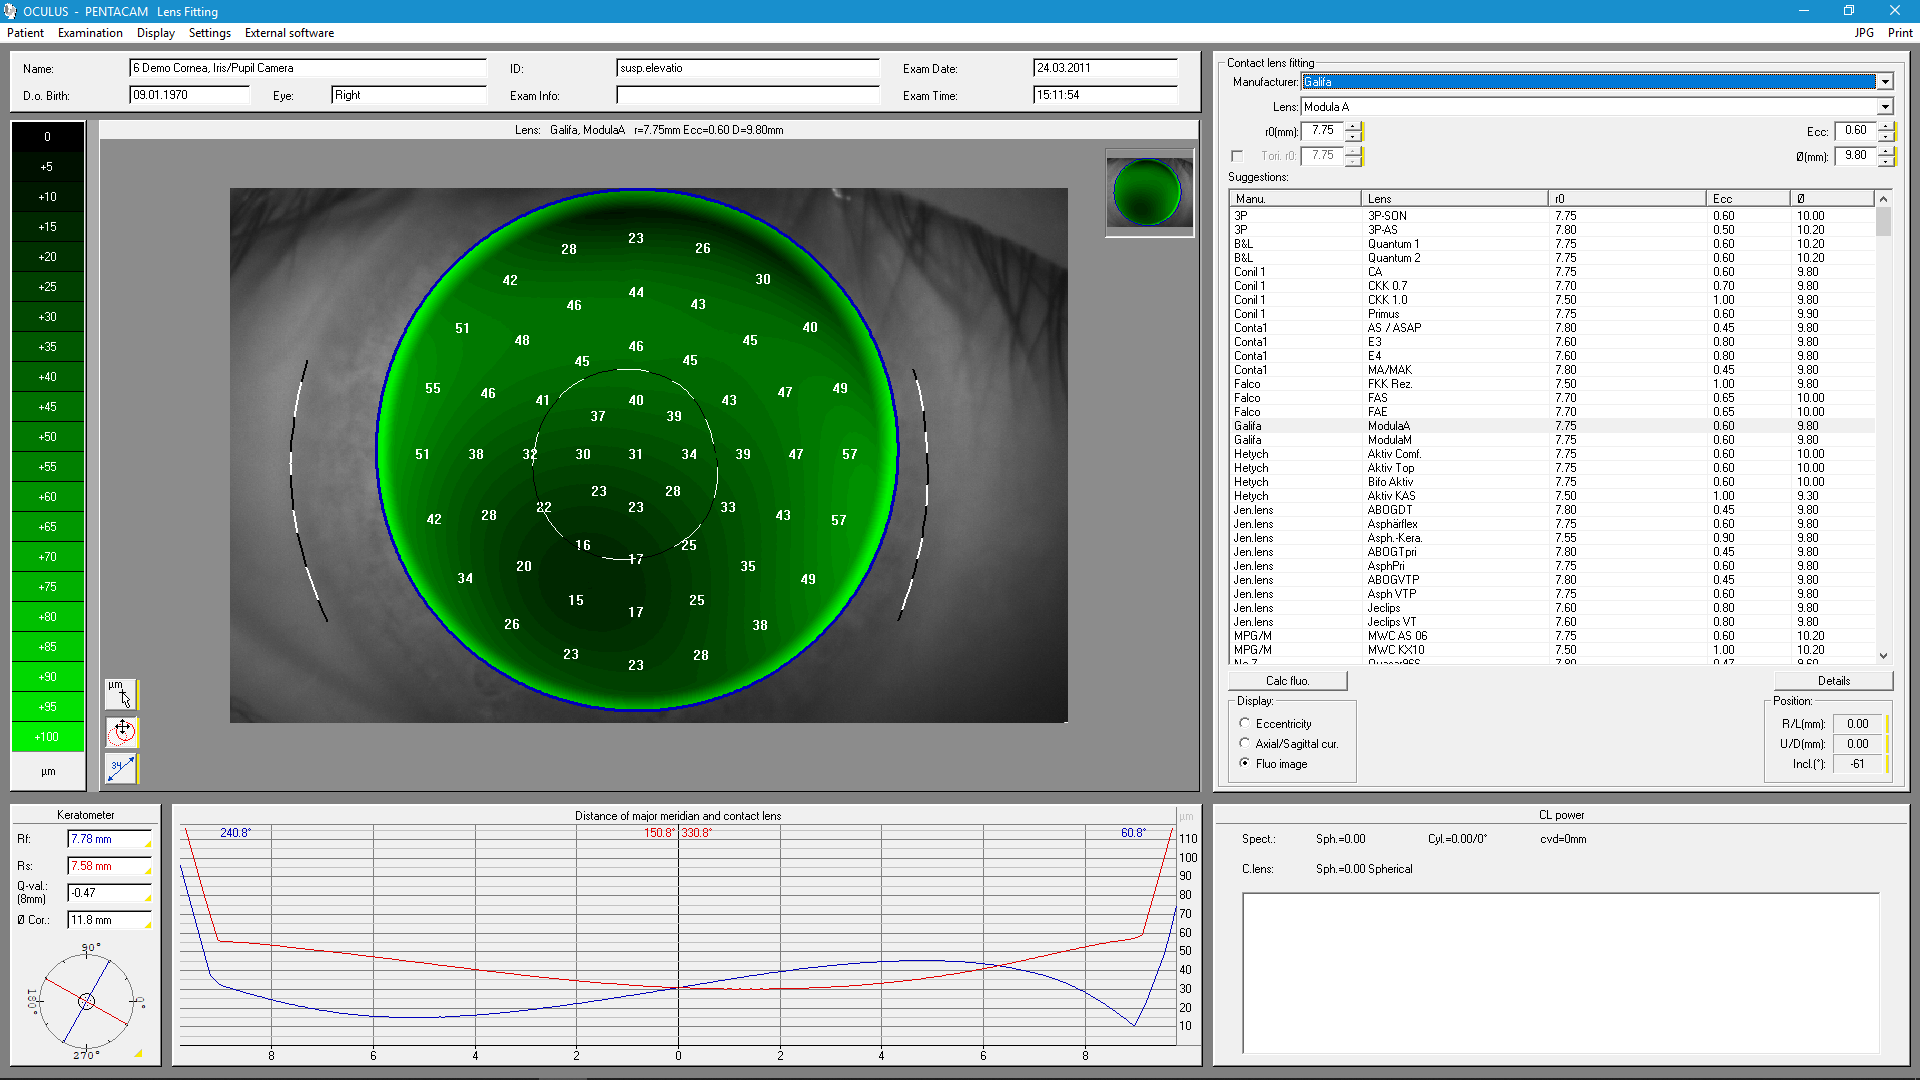
Uses
- Automatic suggestions for contact lenses
- Realistic fluo image simulation
- Integrated database containing over 845,000 lenses
Details
Dynamic fluo image simulation produces an image of how a specific contact lens from the database fits on the eye. The simulation makes it possible to adjust the inclination and position of the contact lens and includes automatic recalculation of the fluo image. The integrated and expandable database contains over 845,000 lenses. The contact lens geometries can be adjusted individually in cases where fitting is difficult. The user can establish his or her own ranking list for contact lens manufacturers.