Pentacam® HR
With its brighter and optimized optics the Pentacam® HR offers you brilliant image quality.
The resolution of its images is five times that of the Pentacam® models, enabling the Pentacam® HR to deliver impressive representations of IOLs and phakic IOLs.
The Pentacam® HR comes with an extensive basic software package which can be extended according to your needs to include further optional software packages and modules.
Pentacam® HR Basic Software
General Overview

Uses
- Comprehensive overview
- Patient consultation
Details
The General Overview provides important information on the keratometry and pachymetry of the cornea in concise numerical form. The Scheimpflug image provides ophthalmologists and their patients with intuitive representations of opacities of the cornea or lens (cataract) or of the position of existing IOLs. The anterior chamber is described in terms of anterior chamber depth, volume and angle. When combined with IOP tonometry readings corrected for corneal thickness the General Overview permits an assessment of glaucoma risk. It also allows the display of all colour maps.
Fast Screening Report
Uses
- Quick detection of irregularities
- Patient consultation
Details
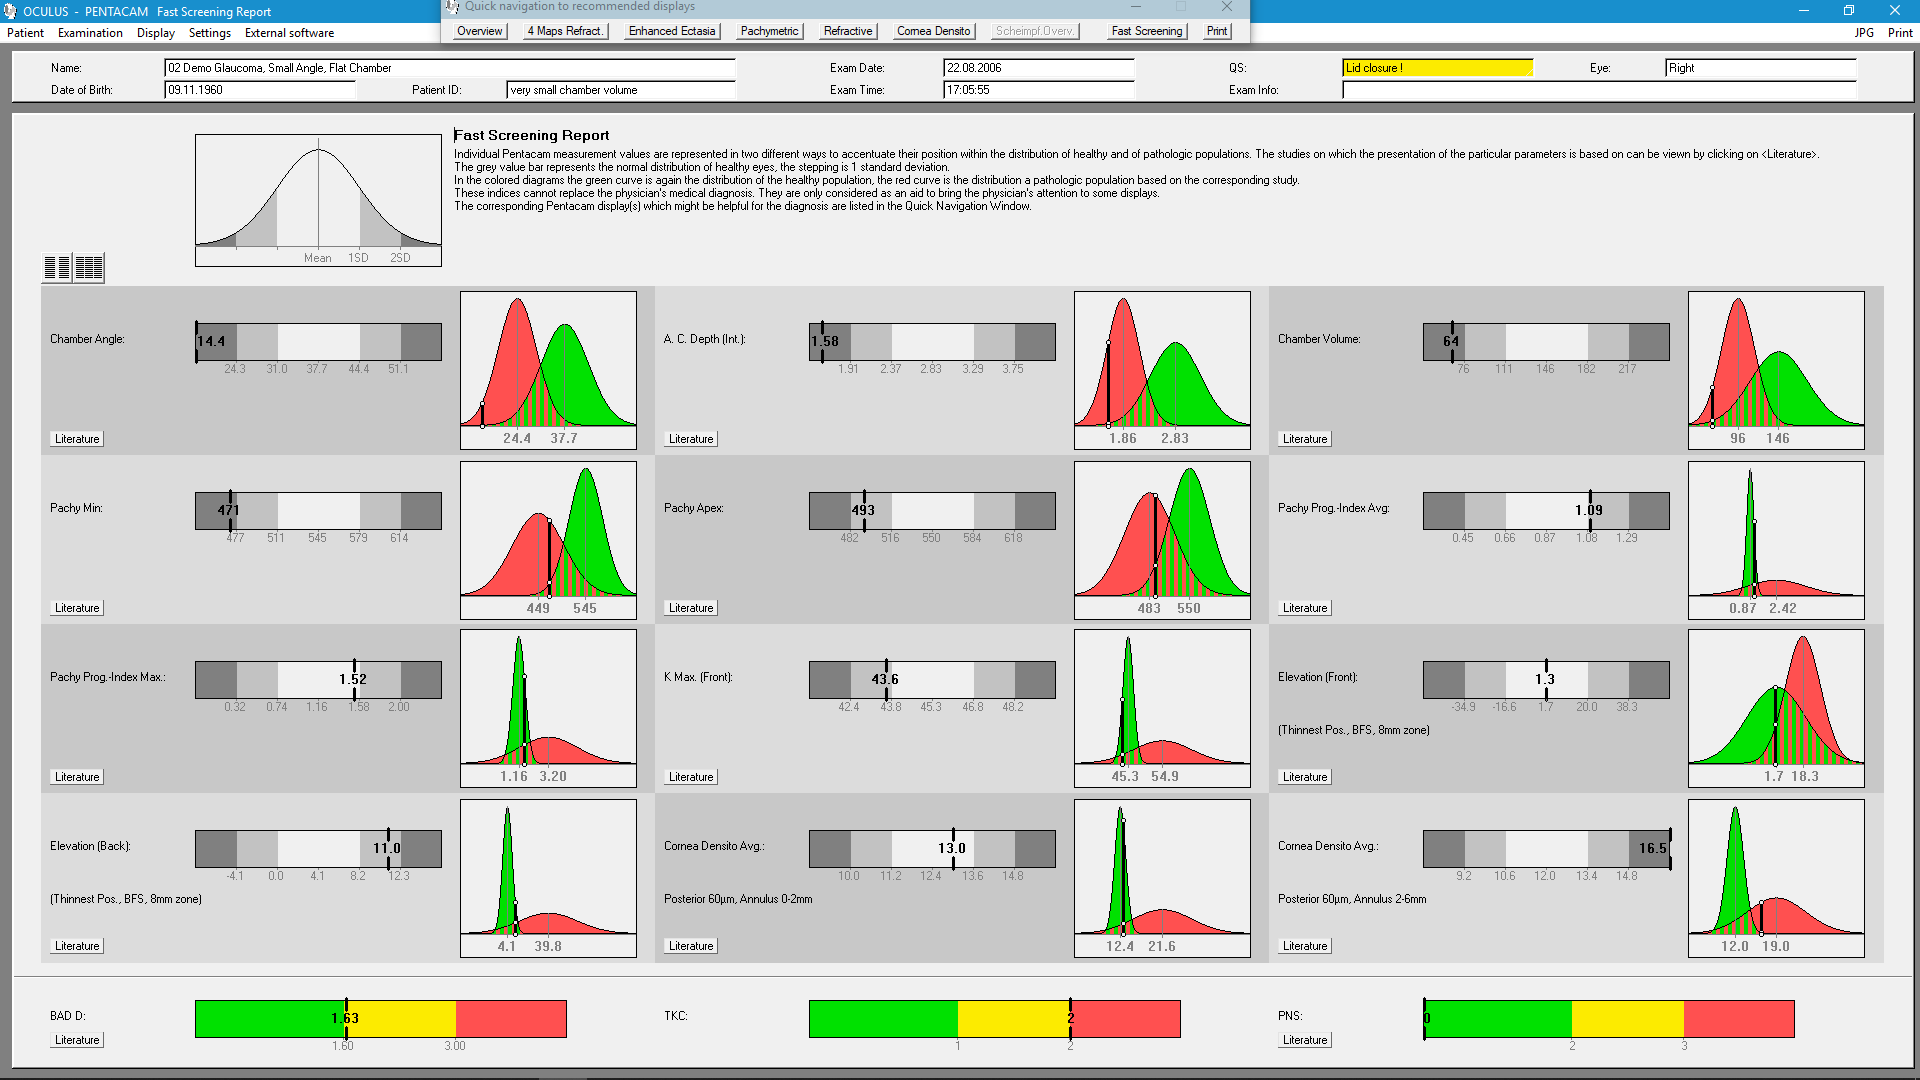
The Fast Screening Report provides a quick and simple overview that allows detection of irregularities in the anterior eye segment. Further displays for evaluating such irregularities in detail can be accessed via the navigation bar. Parameters are displayed against their normal distribution in healthy (green) as well as affected (red) populations as reported in published studies. The publication used in each case is identified under “Literature”. This display does not purport to give any kind of diagnosis. Diagnoses are the sole responsibility of the ophthalmologist and must be based on the entirety of information available.
Topometric/KC-Staging
Uses
- Display of eccentricity results by zone
- Topography of the anterior and posterior corneal surface
Details
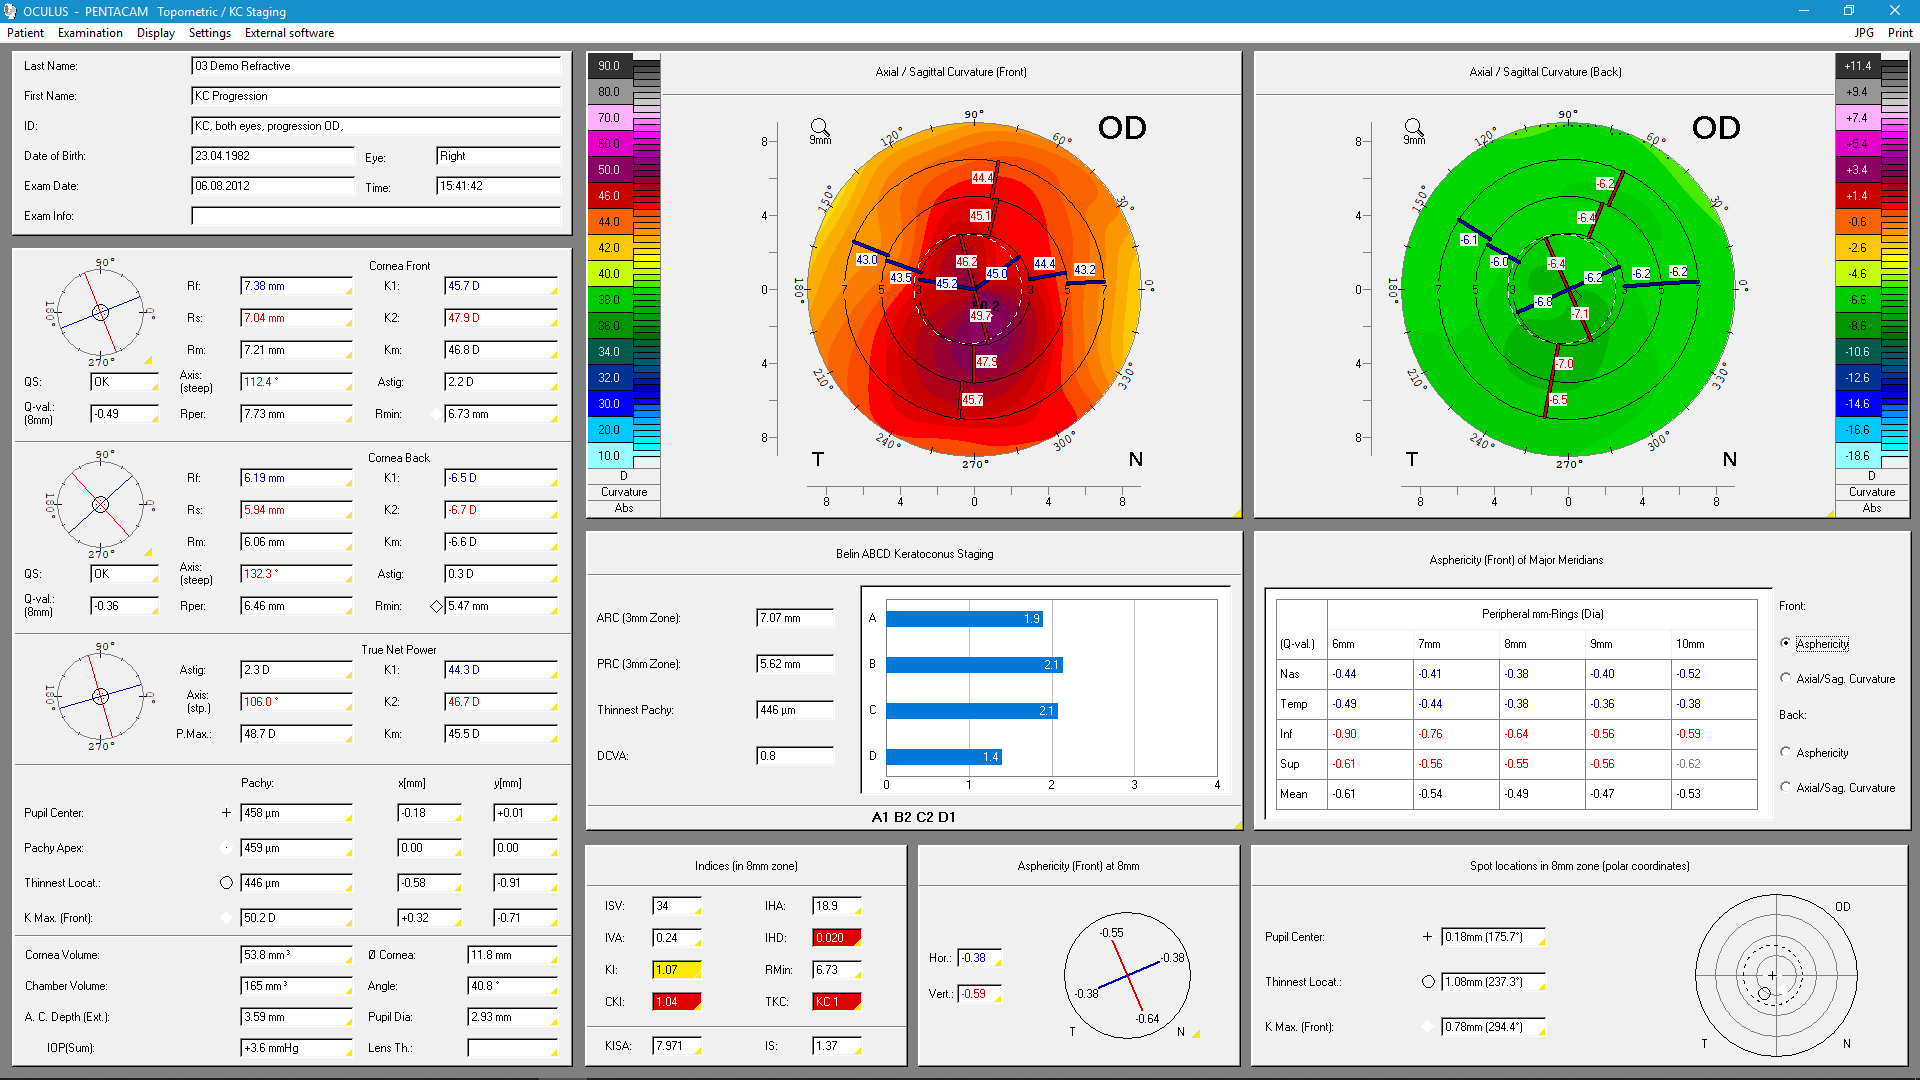
The rotating measurement principle guarantees high resolution output for the central cornea. The topographic analysis of the anterior and posterior corneal surfaces is based on the measured elevation data.
- Display of sagittal and tangential curvature of radius and refractive power
- Various elevation maps based on freely selectable reference surfaces
- Determination of true net corneal power with due consideration also to the posterior corneal surface
- Various four-map displays with default or freely configurable settings
- Subtractive and comparative representations of various examinations
Belin ABCD Progression Display

Uses
- NEW: Objective progression analysis after CXL treatment
- Keratoconus progression for up to eight exams per eye
- Direct comparison of right and left eye
- Retrospective application
Details
The Belin ABCD Progression Display allows direct comparison of up to eight exams per eye. The four parameters A (= anterior radius of curvature in 3 mm zone), B (= back/posterior radius of curvature in 3 mm zone), C (= corneal thickness at thinnest point) and D (= distance corrected visual acuity - DCVA) are displayed one above the other for easy detection of any trend of progression, both before and after CXL (corneal crosslinking).
The red and green lines indicate the relevant confidence intervals (CI) prior to treatment. The red lines stand for the keratoconus group and the green lines for the normal/healthy group. The solid lines indicate the 95 % CI and the dashed lines the 80 % CI.
The dashed horizontal black line represents the CXL treatment. The change in corneal behaviour after CXL treatment can be objectively analyzed based on the blue 80 % and 95 % confidence intervals. The blue lines only appear if exams are available from 12 months after treatment.
For details, watch video: Prof Belin, MD “Belin ABCD Progression Display – History & Utilization”
The Belin ABCD Keratoconus Staging (Topometric/KC-Staging) display and the Belin ABCD Progression Display can both be used retrospectively.
Tomography
Uses
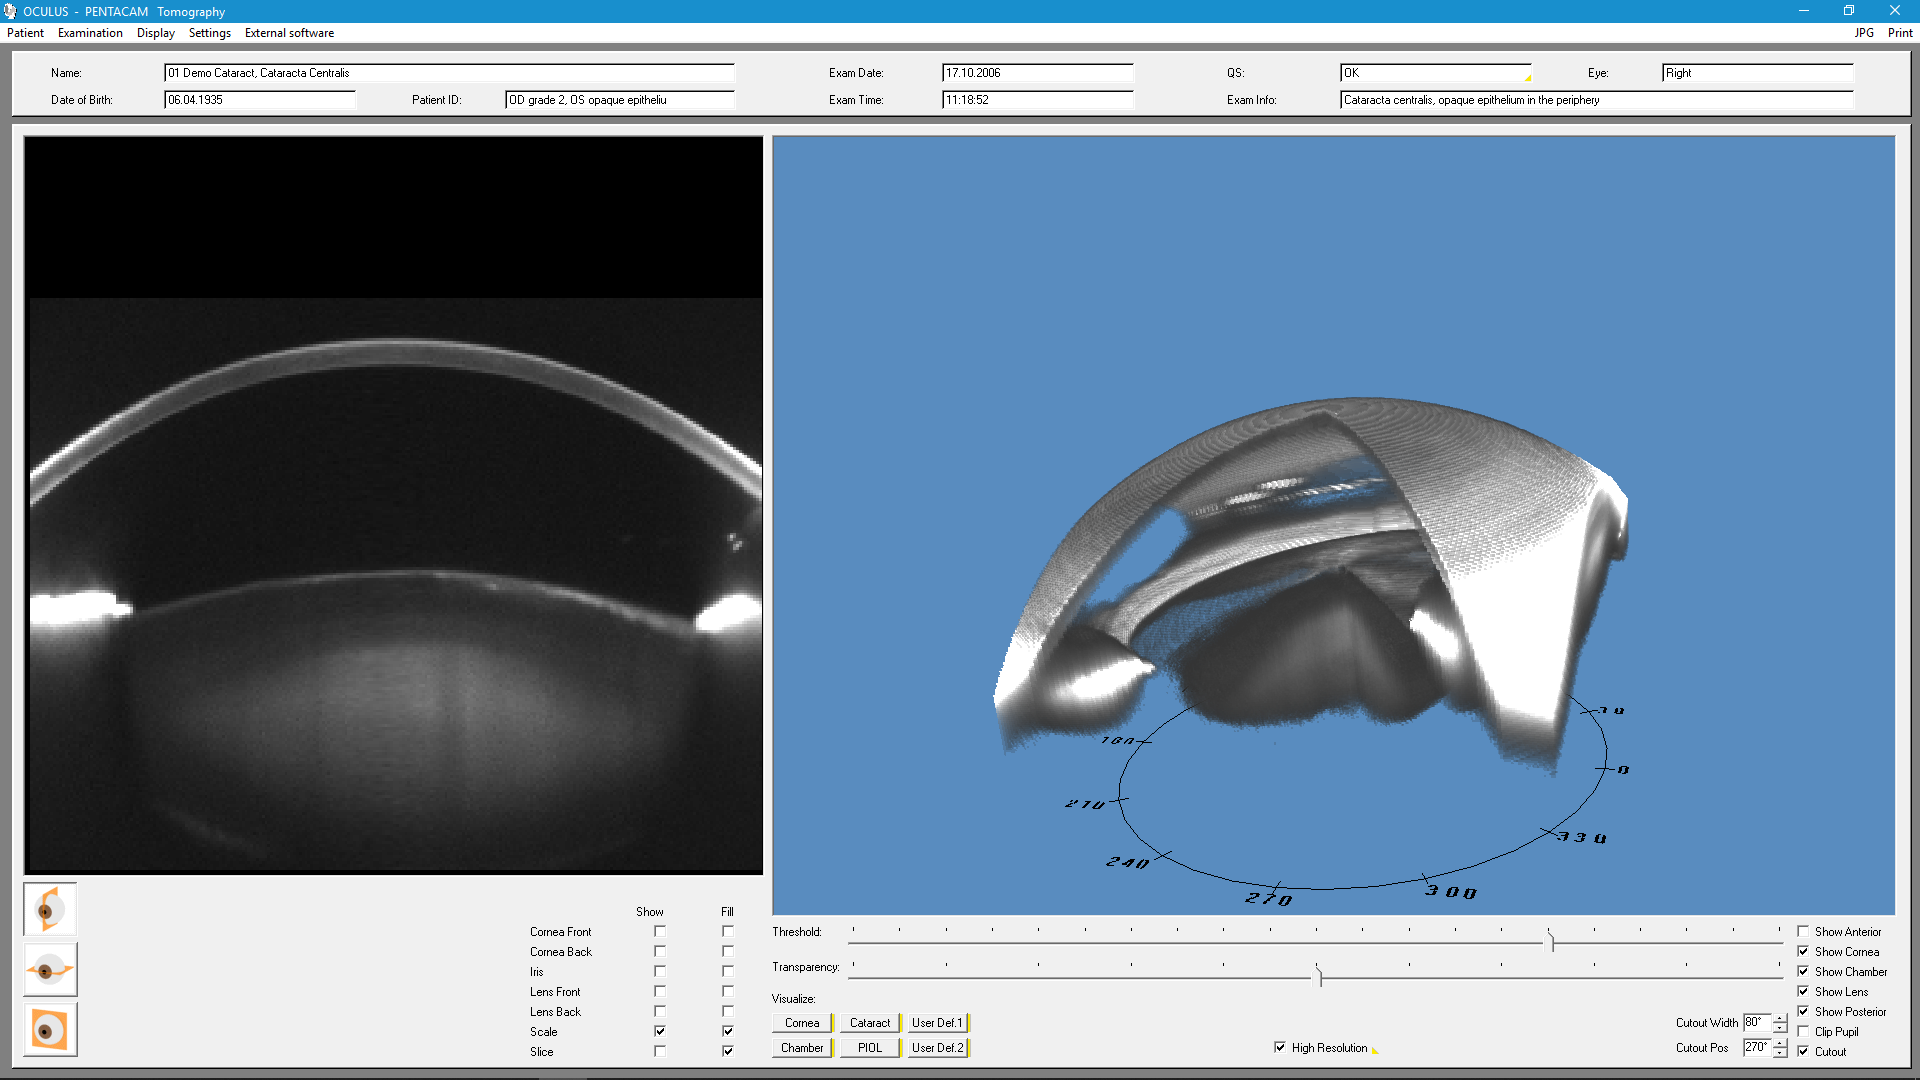
- Changes which become visible in the Scheimpflug image are lucidly represented in a 3D model.
- Anterior segment tomography
Details
The rotatable, pivotable 3D model of the eye proves to be an enormous help when consulting with patients, as it permits the patient to see his or her eye from all sides so that irregularities can easily be explained. It provides a view of the anterior segment as a whole as well as separate views of the cornea and crystalline lens.
Compare 2 Exams
Show/Compare 2 Scheimpflug Images

Uses
- Follow-up
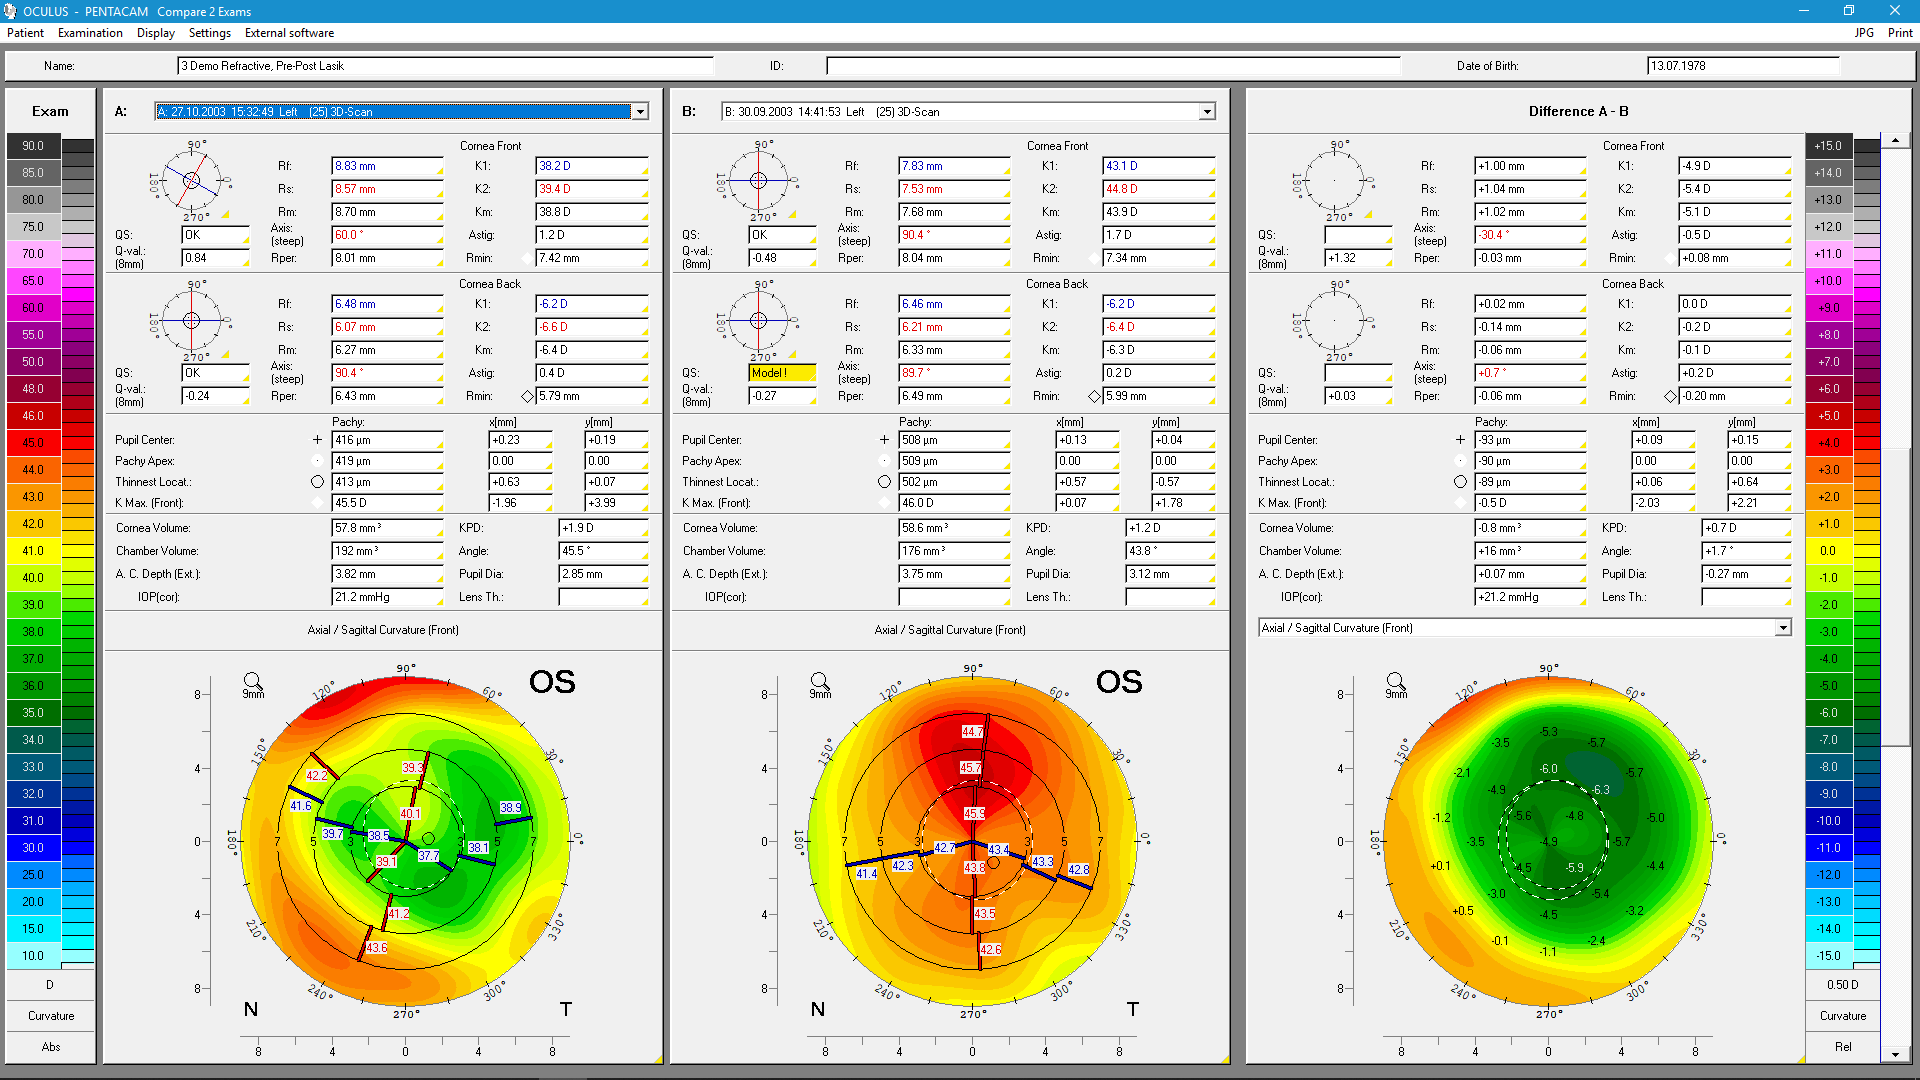
- Comparison of the preoperative and postoperative condition
Detail
All available colour maps from two different examinations can be compared. The course or change over time is displayed in colour maps or numerically in Scheimpflug images.
Scheimpflug Image Overview
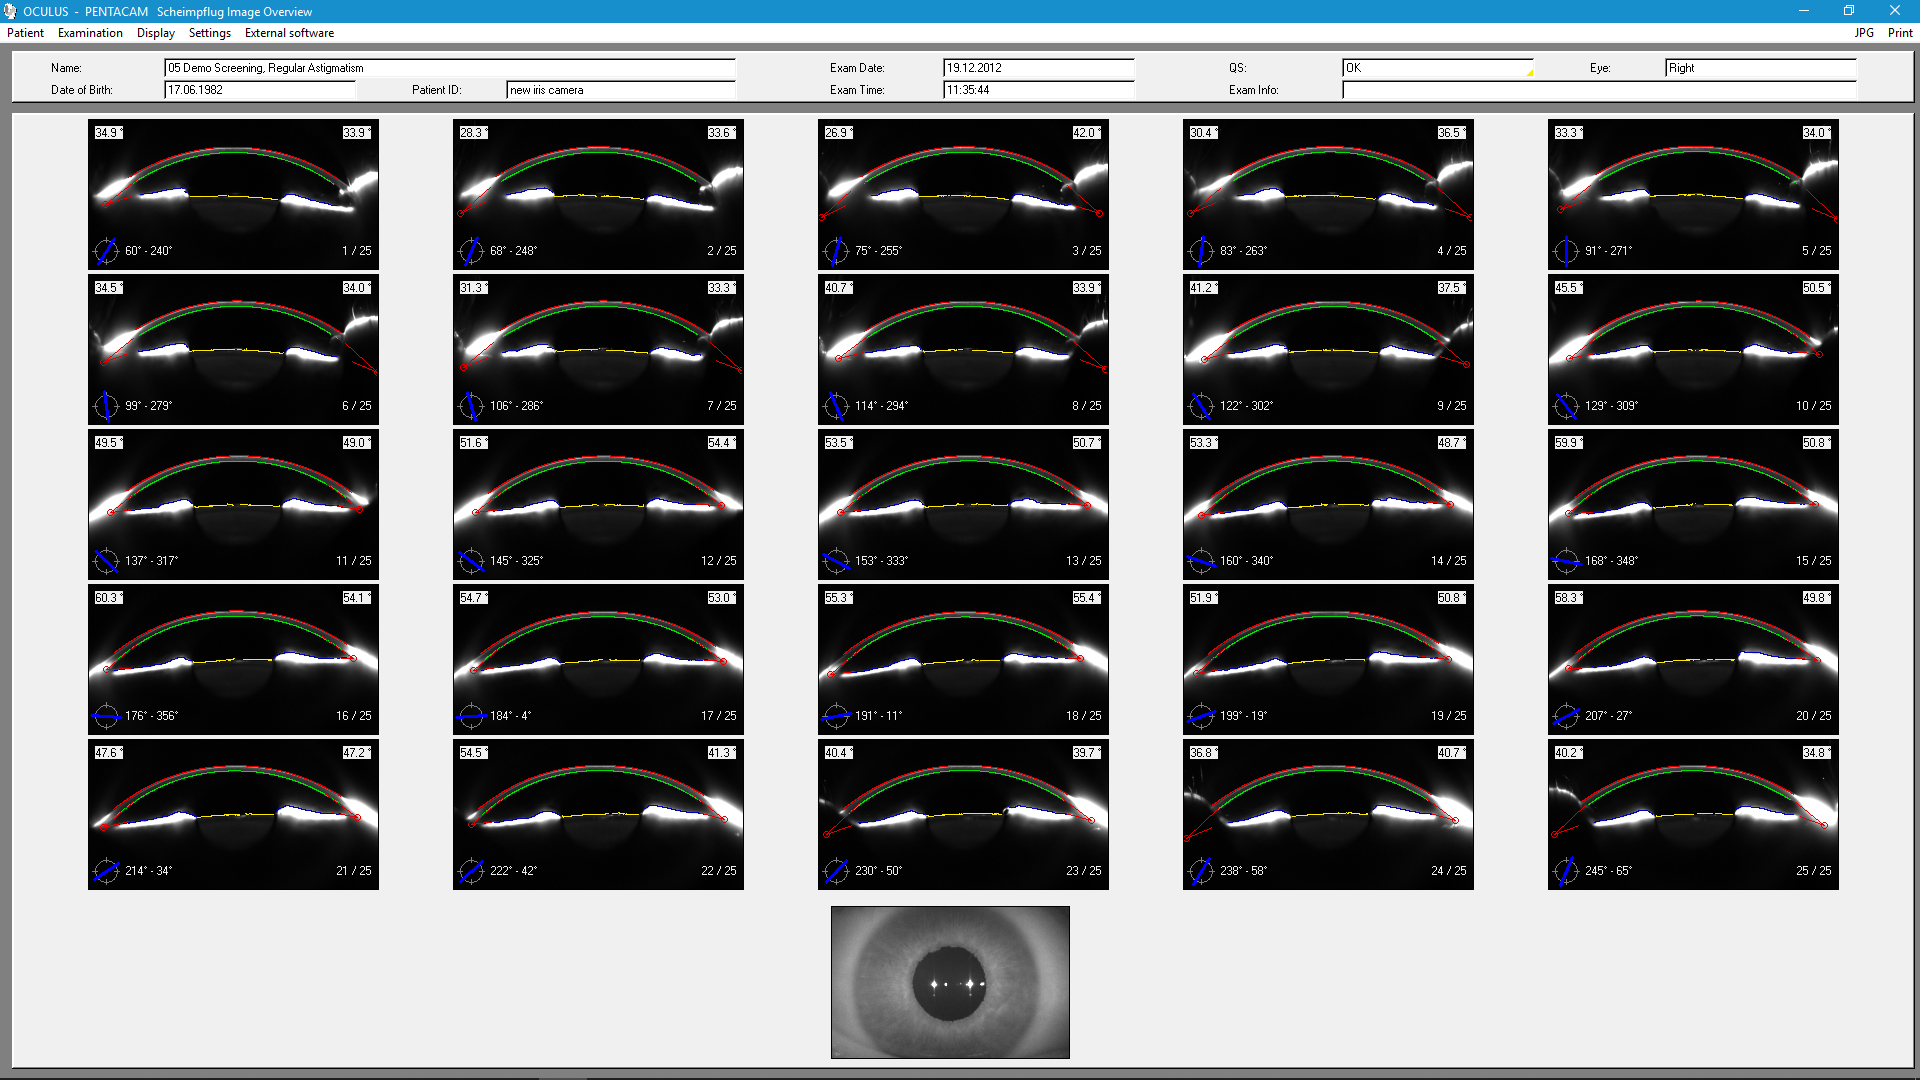
Uses
- Check after scan abortion due to blinking
- All Scheimpflug images at a glance
Details
All Scheimpflug images are shown. This makes it possible, for example, to spot interferences with the measurement process (light, blinking by the patient etc.) at a glance. This display appears directly after completion of the measurement, providing the option of stopping further calculations and repeating the measurement. However, this is not intended as an alternative to the automatic assessment of image quality, displayed as QS (quality specification). It can reveal first signs of opacification of the cornea or crystalline lens.
The display is also useful for detecting first signs of opacification of the cornea or crystalline lens.
More information about the Pentacam® HR:
Core functions Basic software Optional software Model line-up