Differences between the various topography maps of the Pentacam®
- All topography maps of the Pentacam® are originally based on elevation data derived from Scheimpflug images and from the 3D model of the anterior eye segment that is calculated from those images.
- The sagittal and tangential radii are calculated directly from the elevation data.
- Several factors must be taken into account in converting radii of curvature into power values:
A. The Refractive Effect
A sphere has the same radius of curvature at every position, but due to spherical aberration the refractive power is not the same everywhere. When radii are directly converted into power values, according to the laws of Gaussian optics, the refractive effect is not taken into account. In a topography map, calculated without considering the refractive effect, a sphere with a radius of, e.g., 8 mm will show the same power of 42.2 D at every point of its surface.
B. Inclusion of Anterior / Posterior
By convention, most keratometers use the keratometer calibration index of 1.3375 to calculate power from the anterior radius alone. In doing so they assume, firstly, that the cornea has a single refracting surface and, secondly, that the ratio between the radii of the posterior and anterior surfaces is constant (82.2%). For untreated eyes this calculation method is usually sufficiently accurate. After refractive corneal surgery, however, it is no longer possible to calculate corneal power based only on the anterior surface, as the ratio between the anterior and posterior radius of curvature of the cornea has changed considerably. In these cases the corneal radii of the posterior surface must be included in the analysis.
C. The Refractive Index
For historical reasons, most Placido topographers and keratometers use a refractive index of 1.3375 for calculating corneal power. However, this refractive index is actually incorrect, even for the untreated eye (n ≈ 1.332). Most intraocular lens (IOL) power calculation formulas use n=1.3375 to calculate the desired ‘K-reading’, necessitating empirical correction to obtain the correct IOL power even in normal cases.
For post-LASIK patients this empirical correction can no longer be used because it is now necessary to take the radii of curvature of both the anterior and the posterior surface into account (see B). When the curvature values are converted to power values, using the refractive indices of air, corneal tissue and aqueous fluid the resulting power values can no longer be put directly into the IOL formulas. Since the IOL formulas already provide an empirical correction this would result in a double correction. For this reason, power values calculated by this method must first be converted into equivalent K-values before they can be put into formulas that are based on a refractive index of 1.3375.
Some modern formulas, however, are able to deal with the actual, measured curvature data of the front and back surface of the cornea. Examples are the BESSt II formula by Dr. Edmondo Borasio, PhacoOptics by Dr. Thomas Olson and Okulix by Dr. Paul-Rolf Preussner.
D. Location of the principal planes
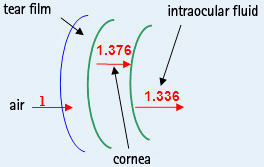
Calculation of corneal power by ray tracing involves sending parallel light through the cornea. It must be taken into account that each light beam is refracted according to the refractive indices for air (n1 = 1), corneal tissue (n2 = 1.376) and aqueous tissue (n3 = 1.336), the slope of the surfaces, and the exact point of refraction. This is necessary because the principal planes of the anterior and posterior surface differ slightly from one another (corneal thickness).
The conventional method of calculating true net power does not consider the slight difference in location of the principal planes of the anterior and posterior surface.
1. The Sagittal Curvature Map (sagittal is synonymous to axial)
This map considers neither the refractive effect (A) nor the radii of the posterior corneal surface (B). It is furthermore based on a refractive index of 1.3375 (C). Conversion of sagittal or tangential radii to power values is performed according to the laws of Gaussian optics using the following formula
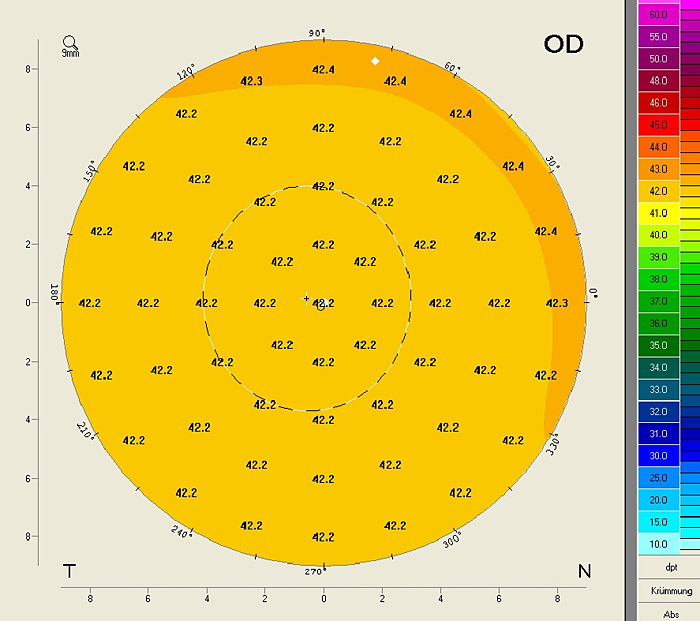
When used to represent a sphere of 8.0 mm this map will show the same power at every point of the sphere’s surface.
It generates the same values as Placido topographers do, as both use the same refractive index. Within the area of the pupil, where the refractive effect is relatively small, sagittal power values will not deviate far from the true refractive power of the cornea. Most IOL formulas are also based on a refractive index of 1.3375. This means that when dealing with untreated eyes one can generally put simulated keratometer (simK) values derived from a Sagittal Curvature Map directly into the appropriate IOL formula. If other “new” keratometer values are to be used in an IOL formula one should first always make a comparison to determine how the “new” keratometer values influence the outcome.
2. The Refractive Power Map (anterior surface)
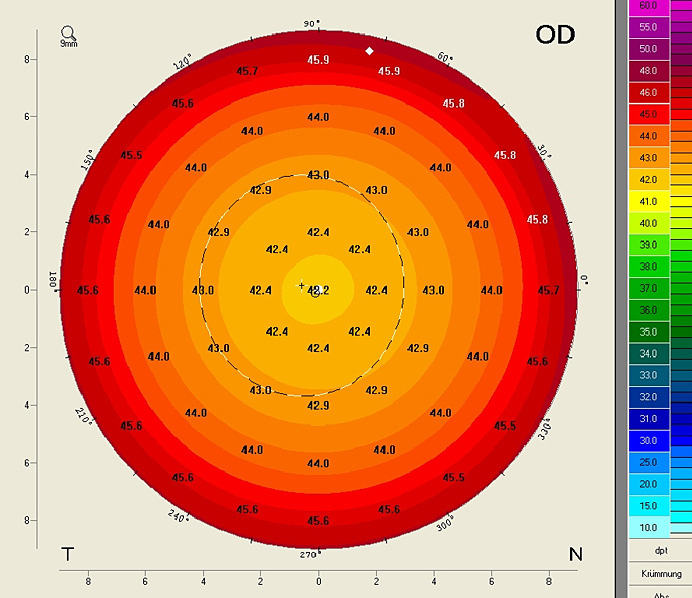
This map exclusively uses curvature values from the anterior surface (B) and is based on a refractive index of 1.3375 (C). In contrast to the Sagittal Power Map, however, this map takes the refractive effect (A) into consideration. It uses Snell’s law of refraction to convert curvature values into refractive power values.
For this reason, the Refractive Power Map of a sphere of 8.0 mm radius gives power values that increase towards the periphery.
3. The True Net Power Map
This map shows the power of the cornea as calculated from the sagittal curvature values of the anterior and the posterior surface. Anterior sagittal power is calculated using refractive indices of n=1 for air and n=1.376 for corneal tissue, while posterior sagittal power is calculated using refractive indices of n=1.376 for cornea tissue and n=1.336 for the aqueous, and the results are then aggregated. In this way the True Net Power Map also takes effect "B" into account. It is based on the following equation (True net power values obviously cannot be inserted in an IOL formula based on a refractive index of 1.3375 because this would amount to a double correction.):

For a spherical shell with rant = 8.0 mm and an inside surface with rpost = 6.58 (rpost/rant = 82%) the resulting refractive power is 40.92. This means that even with an ideal ratio of radii the refractive power shown in the True Net Power Map differs from that in the Sagittal Power Map (effect C).
4. The EKR Power Map (EKR = equivalent K-readings)

This map was designed to take into account the refractive effect as well as the effect of the posterior surface. Another requirement was that its output (equivalent K-readings, or EKR) for untreated eyes should approximate the corresponding SimK values, which are usually derived from the Sagittal Power Map (n=1.3375). EKR values are calculated according to Snell’s laws using the refractive indices of the corneal tissue and aqueous and aggregating the resulting anterior and posterior power values. In a second step, the map is shifted so that for a normal eye (posterior radius 82% of anterior radius) the resulting EKR values match the SimK values from a Sagittal Power Map.
In other words, the "error" that n=1.3375 creates in a Sagittal Power Map is now added to the true power values. In this way the resulting EKR values can be used in IOL formulas that correct for n=1.3375.
Figure 6 shows the EKR Power Map of a spherical shell with rant = 8.0 mm and rpost = 6.58 mm (rpost / rant = 82%). For a spherical shell with this ideal ratio the EKR Power Map is virtually identical to the Refractive Power Map of the anterior surface.
Because the EKR Power Map considers the radii of the curvature of both the anterior and posterior surface, while at the same time matching the output one would obtain from an untreated cornea assuming a refractive index of 1.3375, its output can be used in IOL formulas based on a refractive index of 1.3375, even for the treatment of post-refractive patients. It avoids double correction while also taking the influence of the posterior surface into account. If other “new” keratometer values are to be used in an IOL formula one should, first, always make a comparison to determine how the “new” keratometer values influence the outcome. The study to validate the EKR method was conducted using the Holladay 2 formula. Here it was determined that after LASIK the best correlation with the traditional method, with a mean prediction error of -0.06 D ± 0.56 D, was obtained using a mean zonal EKR for the 4.5 mm zone*. For post-RK patients, the mean prediction error is –0.04 D ± 0.94 D*.
*Jack T. Holladay, MD, MSEE, FACS; Warren E. Hill, MD, FACS; Andreas Steinmueller, MSc: Corneal Power Measurements Using Scheimpflug Imaging in Eyes With Prior Corneal Refractive Surgery: The Journal Of Refractive Sugery, 25, 863-868, 2009 Symes et al; Automated keratometry in routine cataract surgery: Comparison of Scheimpflug and conventional values, J Cataract Refract Surg. 2011 Feb;37(2):295-301
5. The Total Corneal Refractive Power Map
The Total Corneal Refractive Power Map uses ray tracing to calculate power. In a simulation, parallel light beams are transmitted through the cornea and the focal length resulting from their refraction at the anterior and posterior surface is calculated according to Snell’s law of refraction. This refraction is dependent on the true refractive indices of air, corneal tissue and aqueous fluid, the slope of the cornea and the exact point of refraction, which in turn depends on corneal thickness. In this way the simulation takes account of the fact that the principal planes of the anterior and posterior surface differ slightly from one another. From the focal length one can then calculate the power at each point of the cornea in diopters. In this way the map takes effects "A" (refractive effect), "B" (anterior / posterior surface) and "C" (true refractive index) into account, providing the truest possible representation of the power of the cornea.
Figure 8, below, shows the Total Corneal Refractive Power Map of a spherical shell with rant = 8.0 mm and rpost = 6.58 mm.

Although the map gives the truest possible representation of the power of the cornea, its output values cannot be used in IOL formulas based on a refractive index of 1.3375 would amount to a double correction. Aside from IOL calculation the map has another important use for cataract surgeons. Since it takes account of the anterior and posterior surfaces as well as spherical aberration, it provides a means of determining the axis orientation needed for correct placement of the IOL. The following section will show the differences that result from determining axis orientation according to the Sagittal Curvature Map (which takes account of the anterior surface only) or the Total Corneal Refractive Power Map.
Tonn et al, Anterior Surface–Based Keratometry Compared With Scheimpflug Tomography–Based Total Corneal Astigmatism; Invest Ophthalmol Vis Sci. 2015;56:291–298. DOI:10.1167/iovs.14-15659 Savini et al, An Analysis of the Factors Influencing the Residual Refractive Astigmatism After Cataract Surgery With Toric Intraocular lenses; Invest Ophthalmol Vis Sci. 2015;56:827–835. DOI:10.1167/ iovs.14-15903
6. Clinical example: Different axis orientations of the principal meridians of the anterior and posterior corneal surfaces.

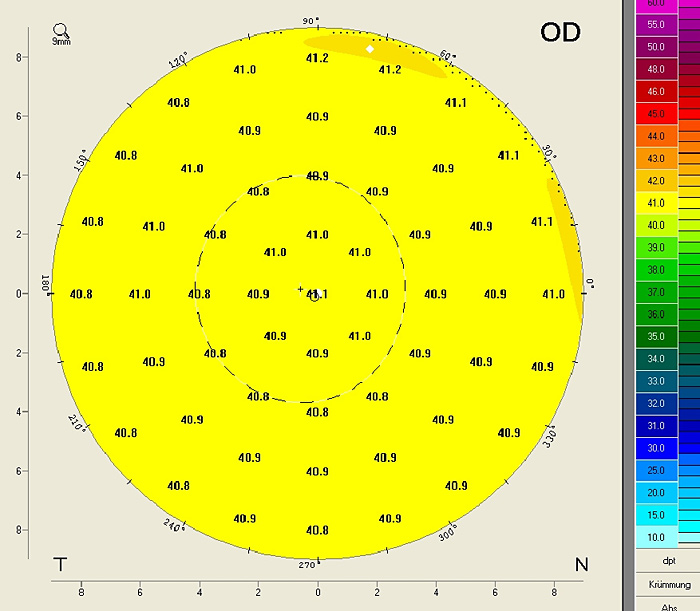
The following clinical example shows the effect of differences in topography between the anterior and posterior surface on the orientation of the principal meridians. The following Pentacam® Four Maps Selectable Display shows the sagittal curvature maps of the anterior and posterior surfaces, the True Net Power Map and the Total Corneal Refractive Power Map. The red and blue lines show the points of minimum and maximum power on each of the rings. The lines are oriented towards the apex. In this way, the extreme values make it possible to determine both the amount of astigmatism and the relevant angles.
It can clearly be seen that the steep and the flat axes of astigmatism are each located at different angles in the sagittal curvature maps of the anterior and posterior surfaces. The axis positions can also be displayed numerically based on the simK values derived from the sagittal curvature maps of the anterior and posterior surfaces at a sagittal angle of 15°. SimK values are, by definition, given on the assumption that the flat and the steep meridians are perpendicular to one another.
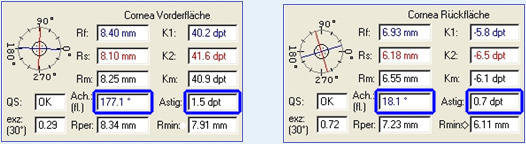
On the anterior surface the flat meridian comes to lie at an angle of 177° and on the posterior at an angle of 18.1°. This means that when both the anterior and the posterior surface are considered this has an effect on both the magnitude and the axes of astigmatism (see Figure 9). To be able to determine the resulting magnitude of astigmatism as well as the angles of the flat and the steep meridians for the different diameter zones (or on the rings), a new display has now been developed which is referred to as the Power Distribution Display. This display gives the cataract surgeon an impression of how evenly refractive power is distributed across the cornea. It also displays the relevant power and angle values, which is useful in aligning toric IOLs.
7. The Power Distribution Display (new)
The new Power Distribution Display gives the K-values for the steep and the flat meridian along with their angle values for each of the diameter zones. The concentric rings defining the diameter zones can be centered either on the apex or on the pupil centre. The display can be set to show the values of the Sagittal Curvature Map, the True Net Power Map or the Total Corneal Power Map. On the bottom right a topographic map can be selected to view the distribution of refractive power over the entire cornea. The histogram on the bottom left shows the distribution of refractive power for a selected diameter zone.
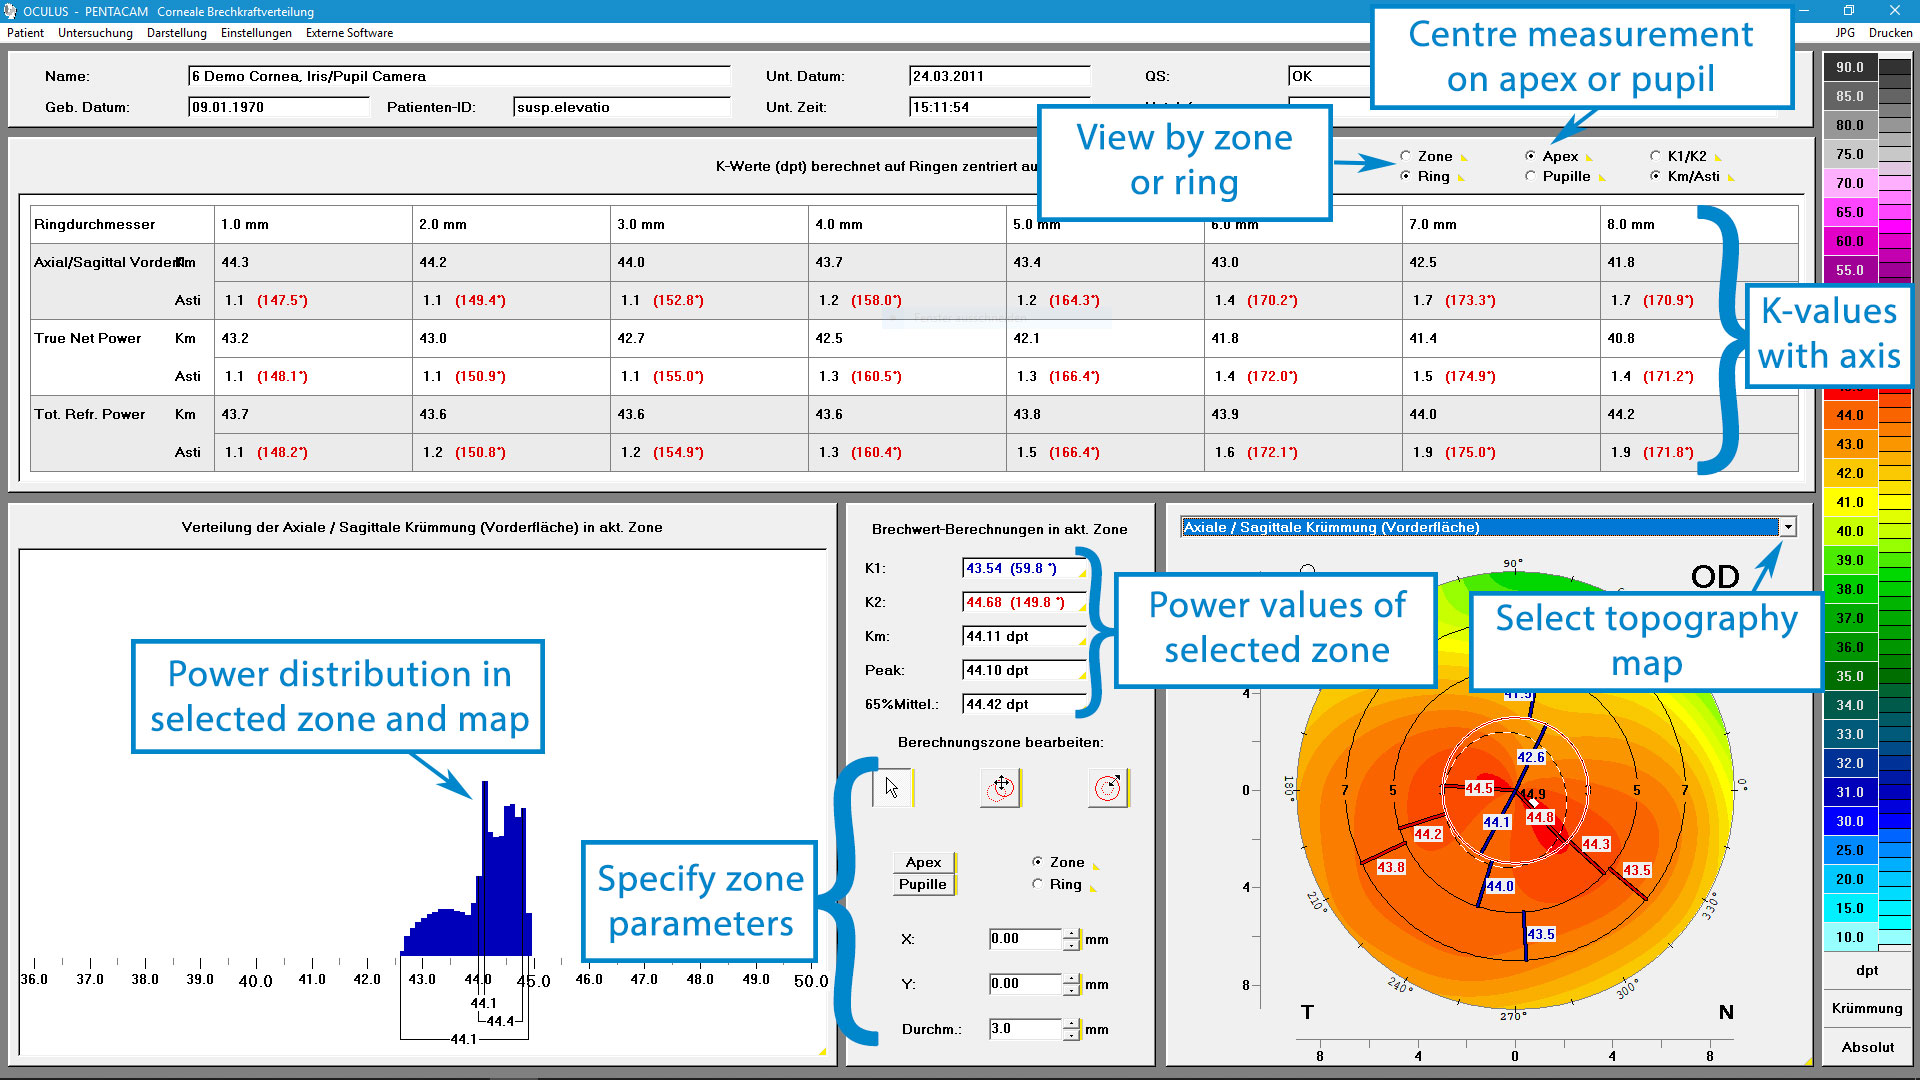
In the example mentioned, in the above section, one can see that the angle of the flat meridian in the 3 mm zone of the Sagittal Power Map (175.4°) deviates from the corresponding angle in the same zone in the Total Corneal Refractive Power Map (162.8°) by 12.6°. This is mainly attributable for the different topography of the posterior surface as compared with the anterior surface. However, as one can see from a comparison with the power values in the True Net Power Map, it is partly also due to spherical aberration. Here the flat meridian of the 3 mm zone is at angle of 167.3°. This example demonstrates the importance of considering the astigmatism of the posterior surface as well as the effect of spherical aberration in determining the orientation of a toric IOL. The information provided on the power distribution also gives an overview of the homogeneity of refractive power over the entire cornea. In this way the Power Distribution Display provides cataract surgeons with vital information in planning an IOL implantation.